EOS, Monero, IOTA Price Analysis: 14 July

Bitcoin was priced at $32,024.68 and was down by 4.1% over the last 24 hours, at press time. Subsequently, other altcoins too witnessed southbound price action. At the time of writing, EOS had lost 8.8% of its valuation in 24 hours, pushing its market cap down on the charts. Monero, despite a decline in its price, noted slight buying pressure and finally, IOTA fell through its crucial support level of $0.72.
EOS

EOS/USD, TradingView
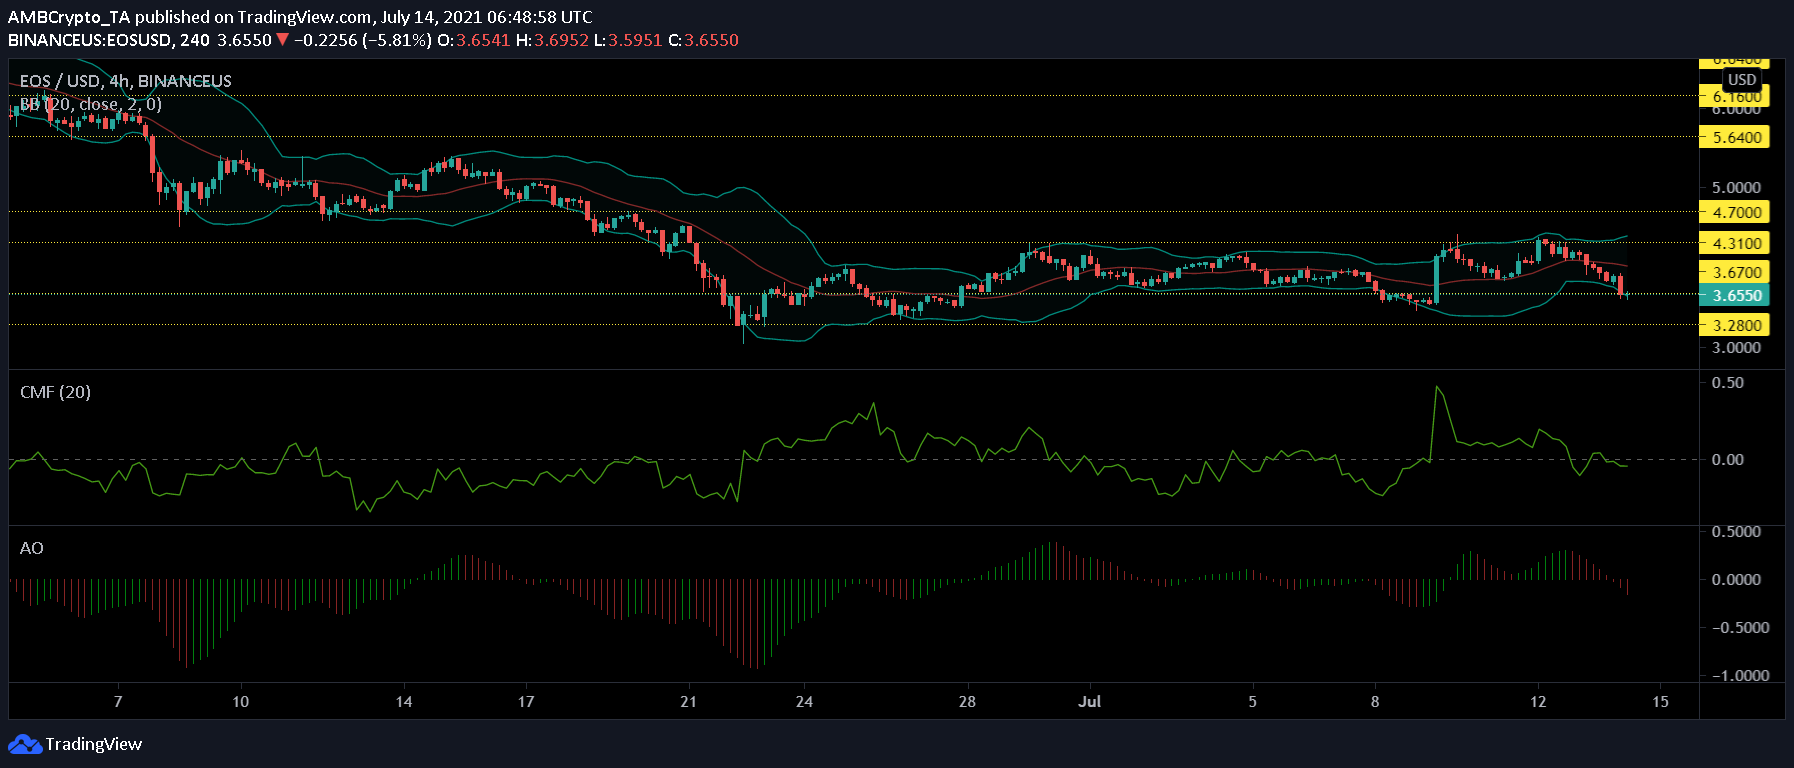
EOS was trading at $3.65 at the time of writing, marking an 8.8% decrease on the day. EOS was trading in the range of $4.31 and $3.88 over the last couple of days before corrections took their toll once again. The said depreciation also had an effect on the trading volume as it noted a 19.79% fall over the last 24 hours.
On the question of volatility, the alt intended to test the $4.70 level. However, it was testing the $3.66 support level at press time. The Bollinger Bands were diverging at the time too, indicating that some volatility can be expected.
Capital inflows dipped again, with the Chaikin Money Flow falling below the centerline and highlighting the strength of capital outflows. EOS’s bearish turn was evidenced by the Awesome Oscillator picturing red signal bars too.
Monero [XMR]

XMR/USD, TradingView
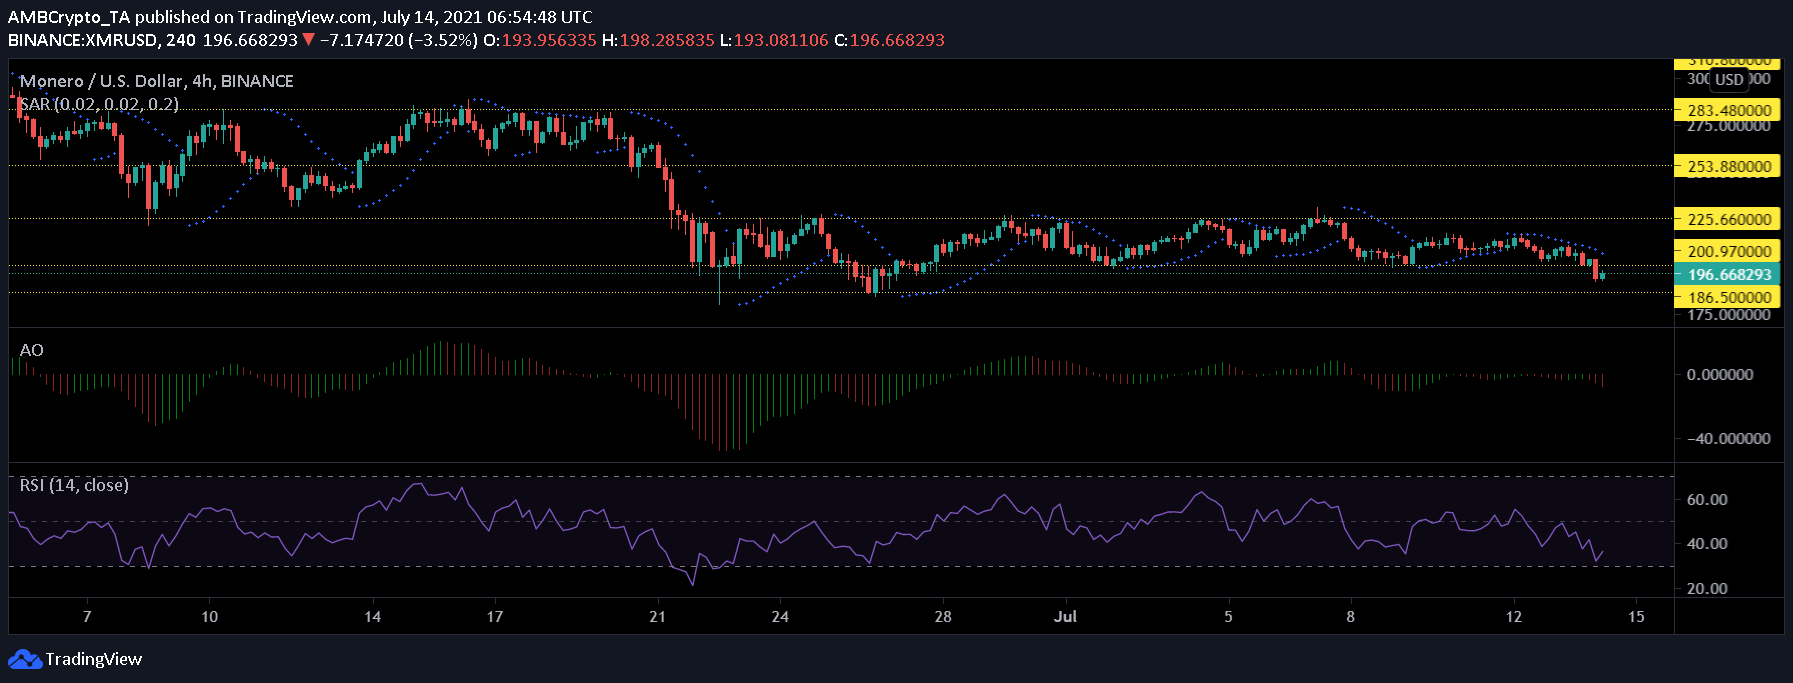
The daily technical chart for Monero pictured that XMR had lost momentum at the time of writing, declining by 6.5% over the last 24 hours. Monero’s price had been consolidating between the resistance and support levels of $225 and $196 over the last week. With today’s fall, the alt’s price fell below the crucial support level of $196.
Some buying signals were evident, however. The Relative Strength Index noted a small uptick at press time, a finding which suggested that buyers came back into the market after the alt’s price fell. Monero’s price trend was validated by the presence of the dotted lines above the candlesticks, as pictured by the Parabolic SAR.
With XMR’s price showing weakness and struggling to stay afloat, the Awesome Oscillator saw rising red signal bars on the histogram.
IOTA

IOTA/USD, TradingView
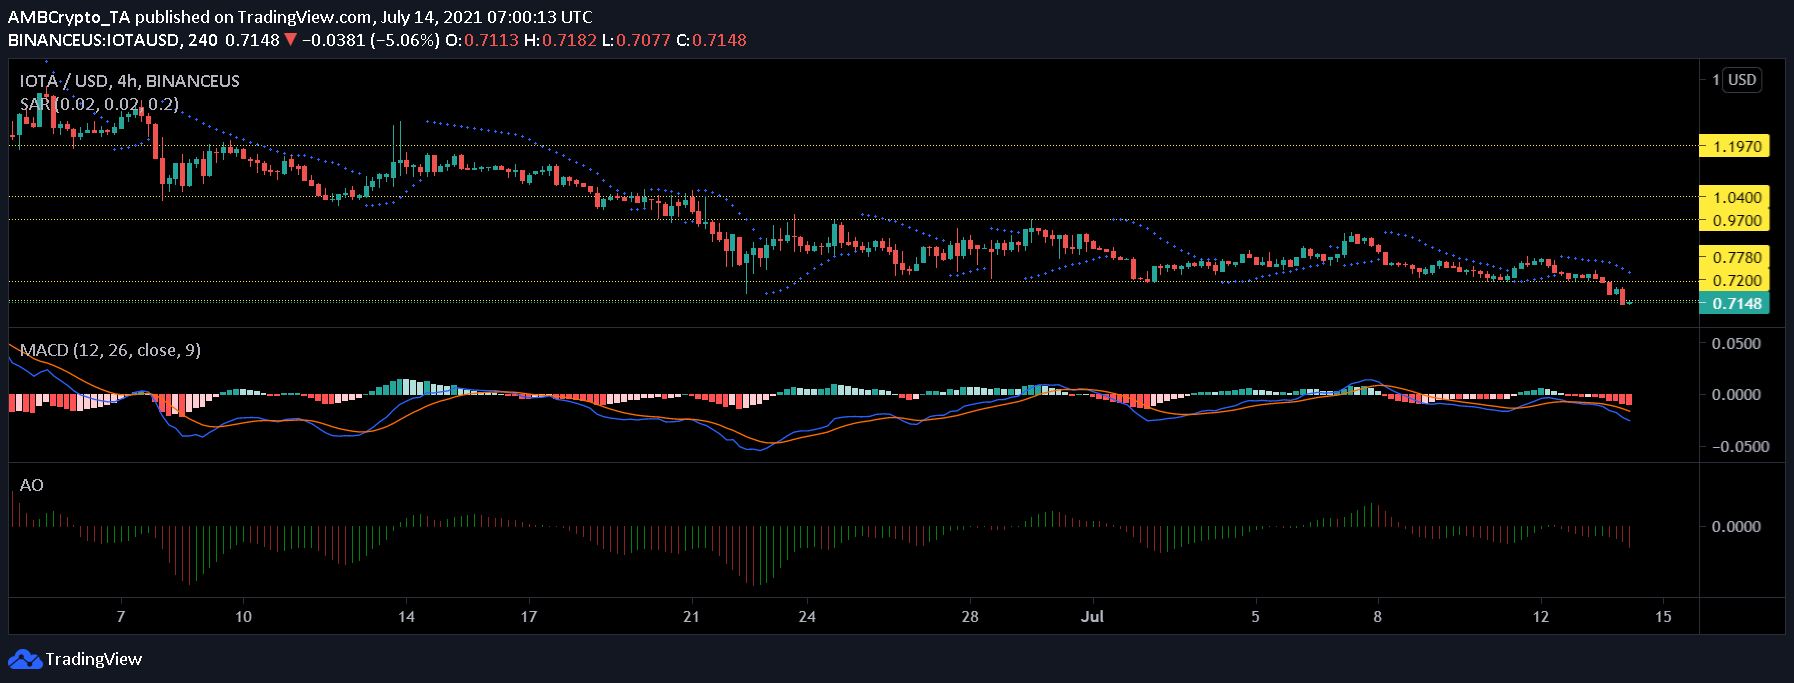
IOTA price movement has remained rangebound since the last week of June. At the time of writing, the alt fell through its vital support level of $0.72 as it was trading at $0.70. This price marked a new low for IOTA since the beginning of July. With a 16.5% decrease in value over the last week, IOTA struggled to move out of the bearish zone.
Parabolic SAR showed that the dotted lines arranged themselves above the price level to imply that a downtrend was in play. The MACD indicator flashed a bearish crossover on 12 July, one which gave off a sell signal. At press time, the red histograms grew in size, implying that the price would move south in the near term.
The Awesome Oscillator also came to the same conclusion.


