EOS, Polkadot, Verge Price Analysis: 13 December

Bitcoin’s recovery over the past couple of days from $17,600 to $19,200 was accompanied by rising Bitcoin dominance. Large-cap alts gained in value over the same period, but in general, they were not as quick to surge. Polkadot broke past the $4.8-resistance level, but it saw bears and profit-taking around the $5 region. EOS broke out of a descending channel, and Verge could be primed for an upside breakout as well.
Polkadot [DOT]
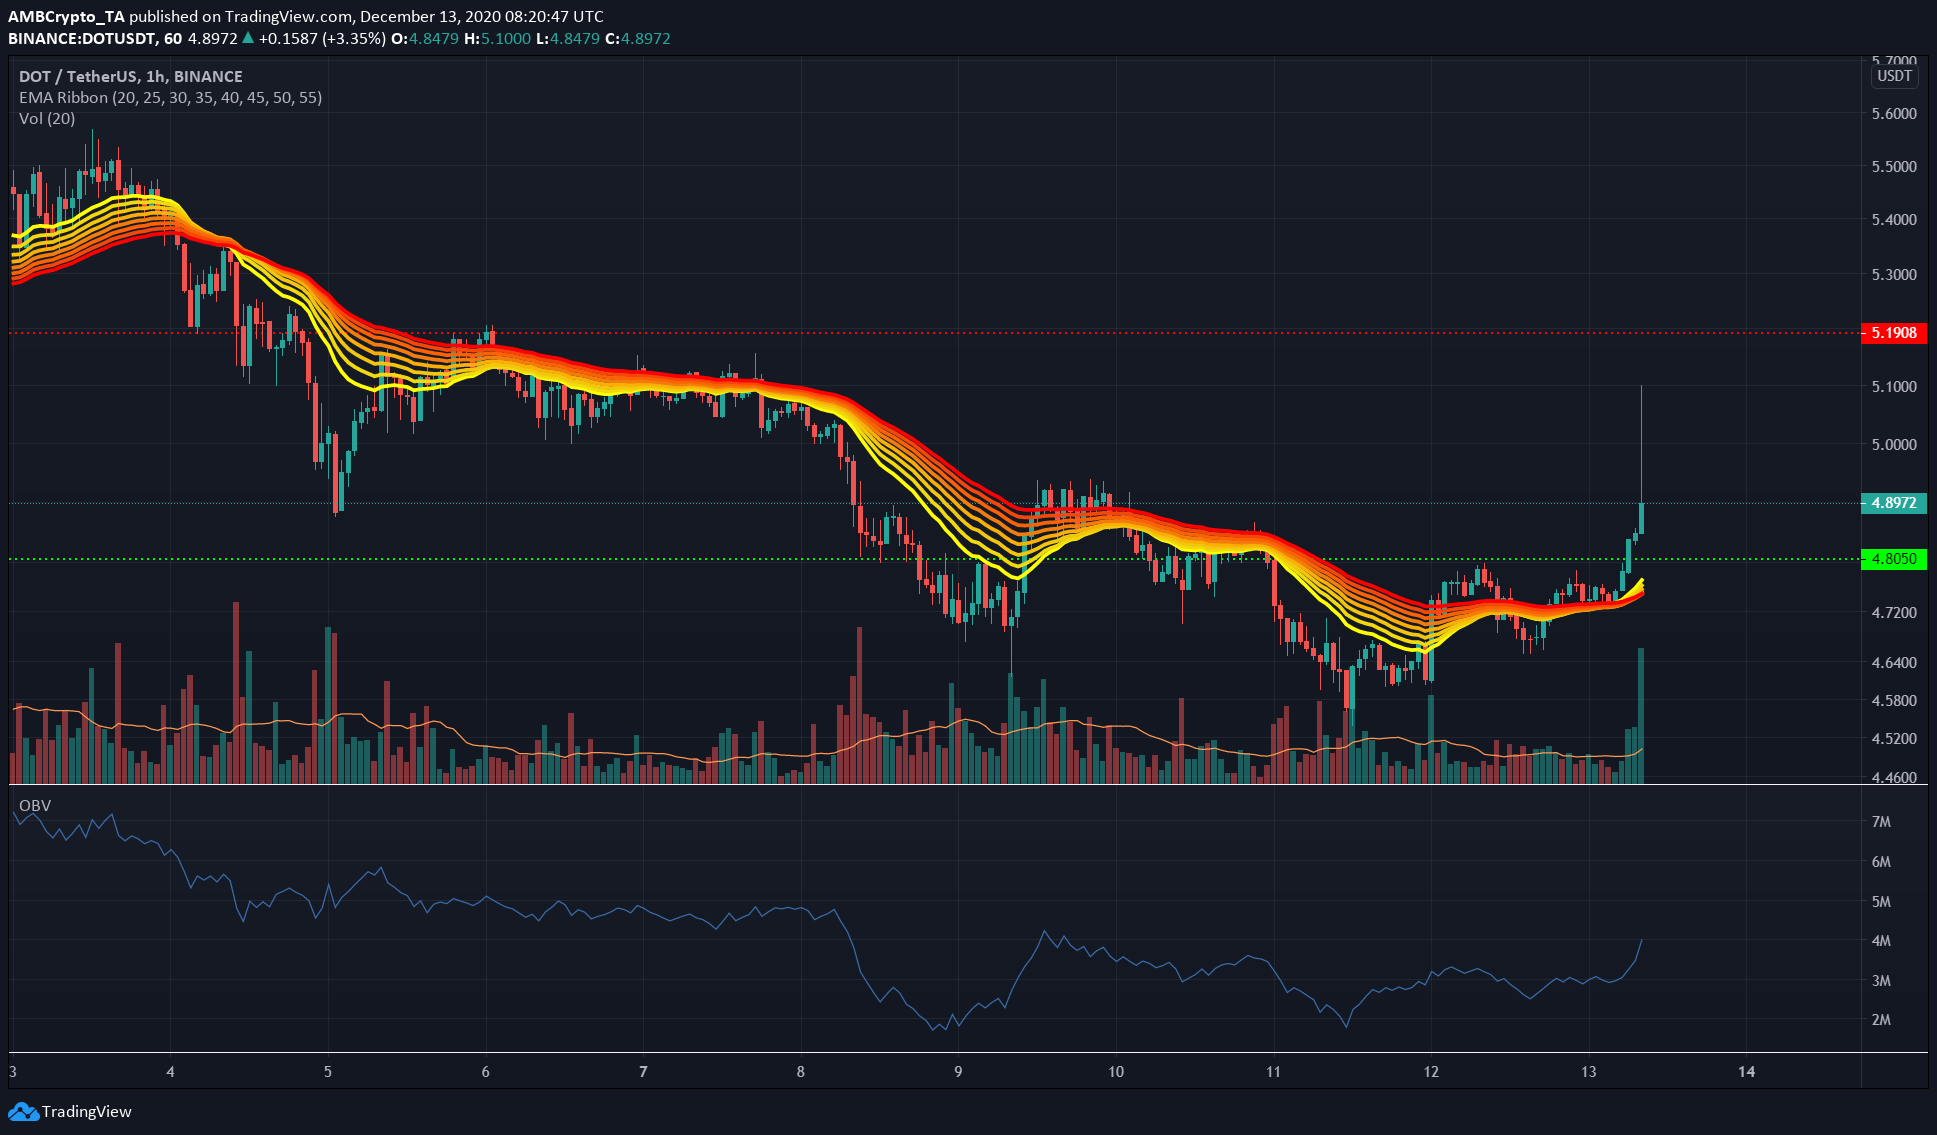
On the 1-hour timeframe, Polkadot had a bullish outlook. The price pierced past the $4.8-resistance on a move with good trading volume. The OBV also formed a series of higher lows over the past couple of days to indicate that short-term bullishness had some buyer interest behind it.
The EMA ribbon twisted to indicate bullishness as well while the price rose above it to further signify the bullish momentum behind DOT.
It is possible that DOT would be pushed back to retest the same level to confirm its flip to support. The long candle wick up to $5.1 was not pretty and showed that the bears still held sway around the $5-region.
EOS
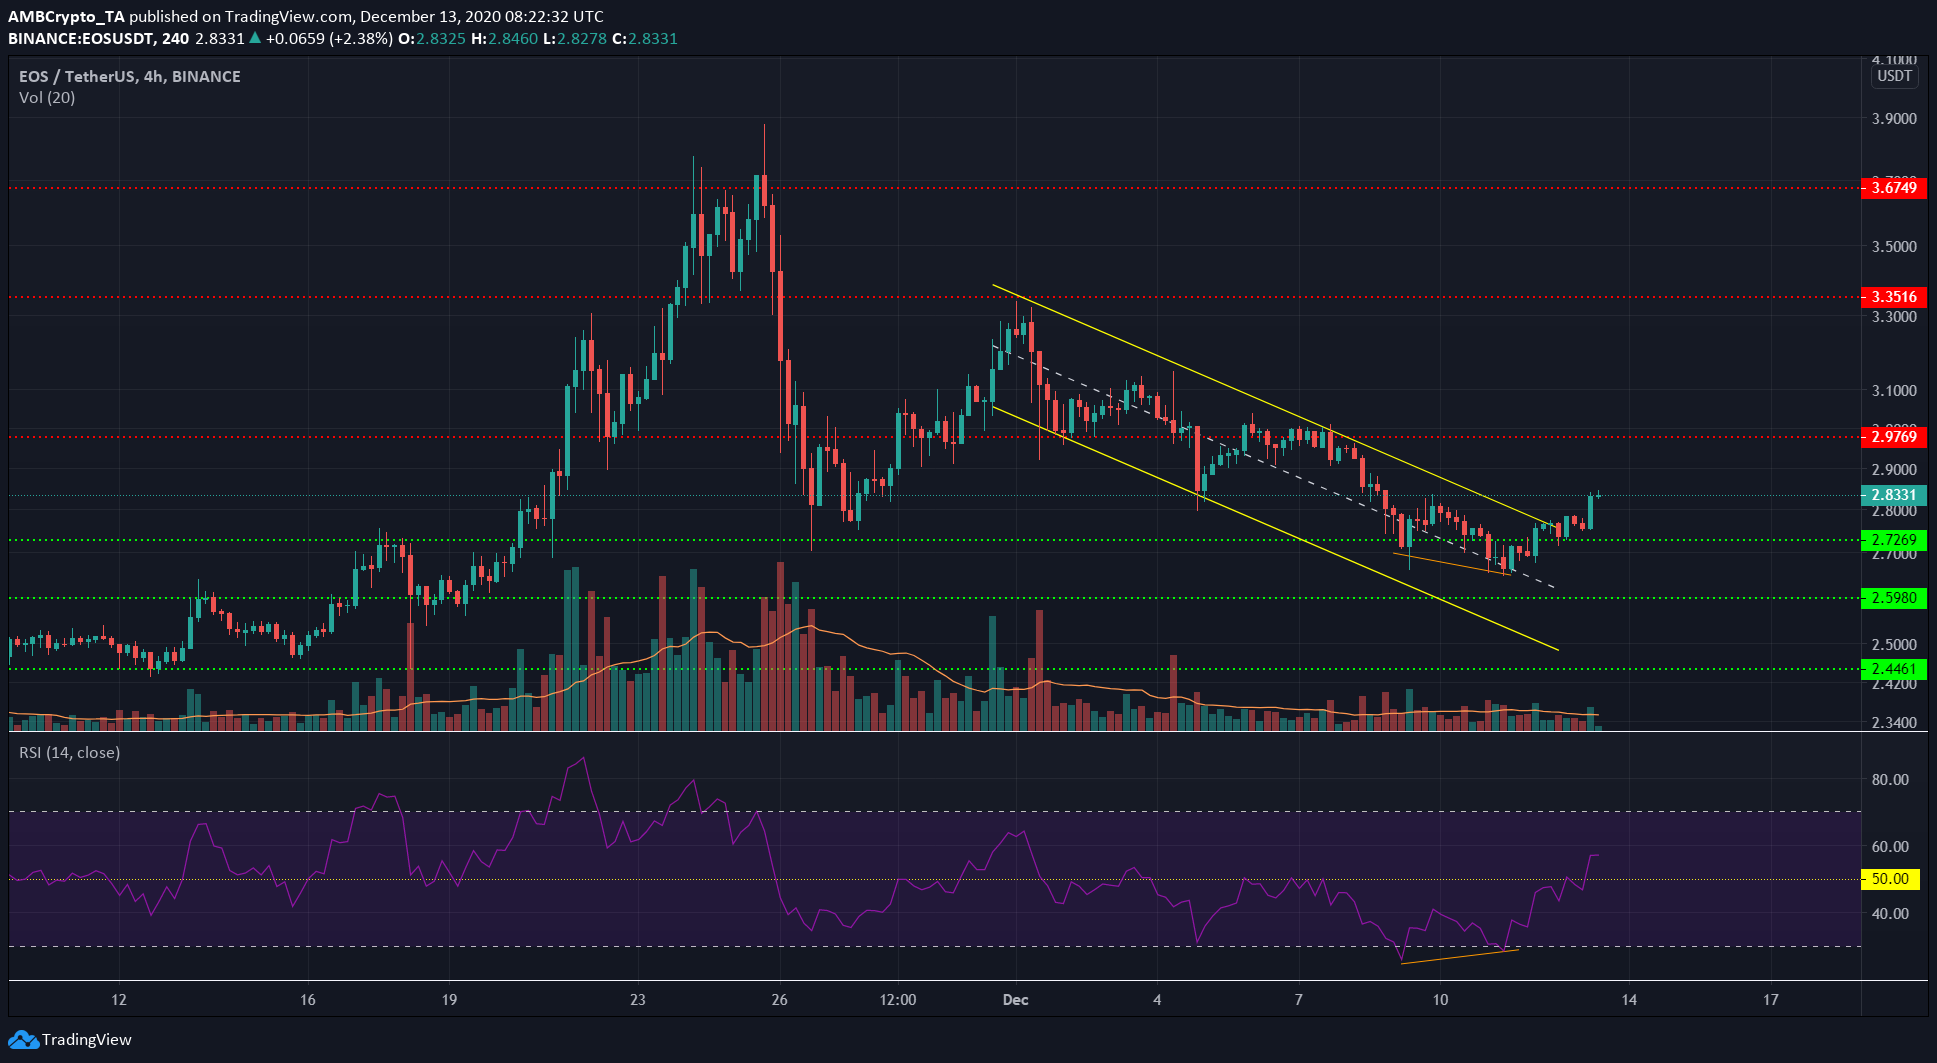
EOS was trading within a descending channel, a bullish reversal pattern that generally sees the price break out and climb to the peak of the pattern, where the channel began.
EOS also exhibited a bullish divergence between the price and the momentum on the 4-hour chart, and subsequently, the price reversed itself and closed above the $2.72-level, as well as the channel.
The RSI rose past 50 and an uptrend was likely initiated, with a target of $3.3 for the bulls in the days to come.
Verge [XVG]
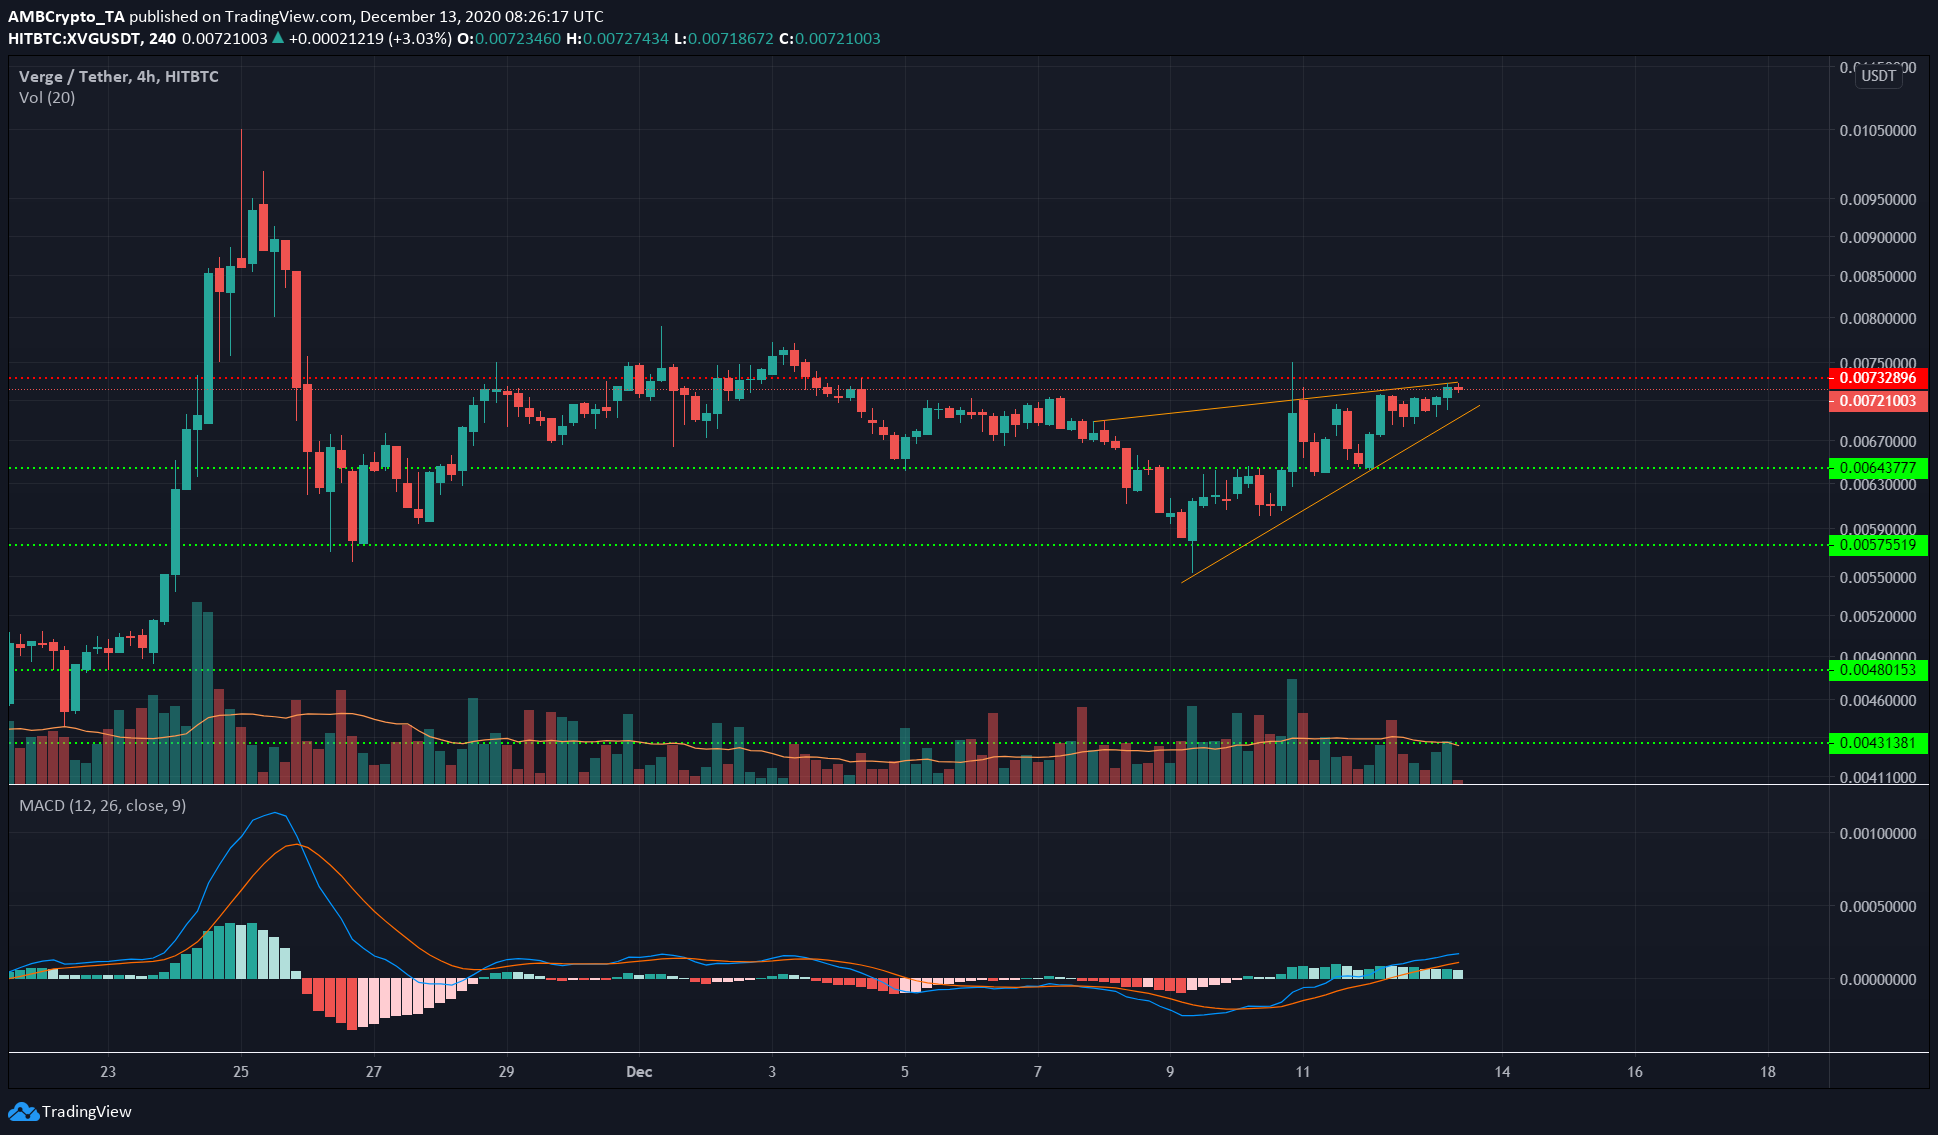
Verge formed a rising wedge pattern. This pattern can see the price break in either direction, with a close outside the pattern generally indicating the breakout direction.
The trading volume has fallen for XVG over the past couple of days as the price approached the level of resistance at $0.0073. However, the MACD highlighted that notable bullish momentum was behind XVG as it crossed above zero.
A close above the resistance level would be bullish for XVG and would set an upside target of $0.0085, while a break to the south could see a test of the $0.0064-support.


