
The larger crypto-market is off to a strong start in 2021, backed by market leaders Bitcoin and Ethereum. In fact, in the past seven days alone, the top-10 coins by market cap have risen by between 13.8% and 74.84%, highlighting the bullish start to the New Year.
However, with investors preparing to lock in their positions, they will need to keep a close watch on Bitcoin’s movement as a correction could shake off the recent highs achieved by the market’s altcoins.
EOS
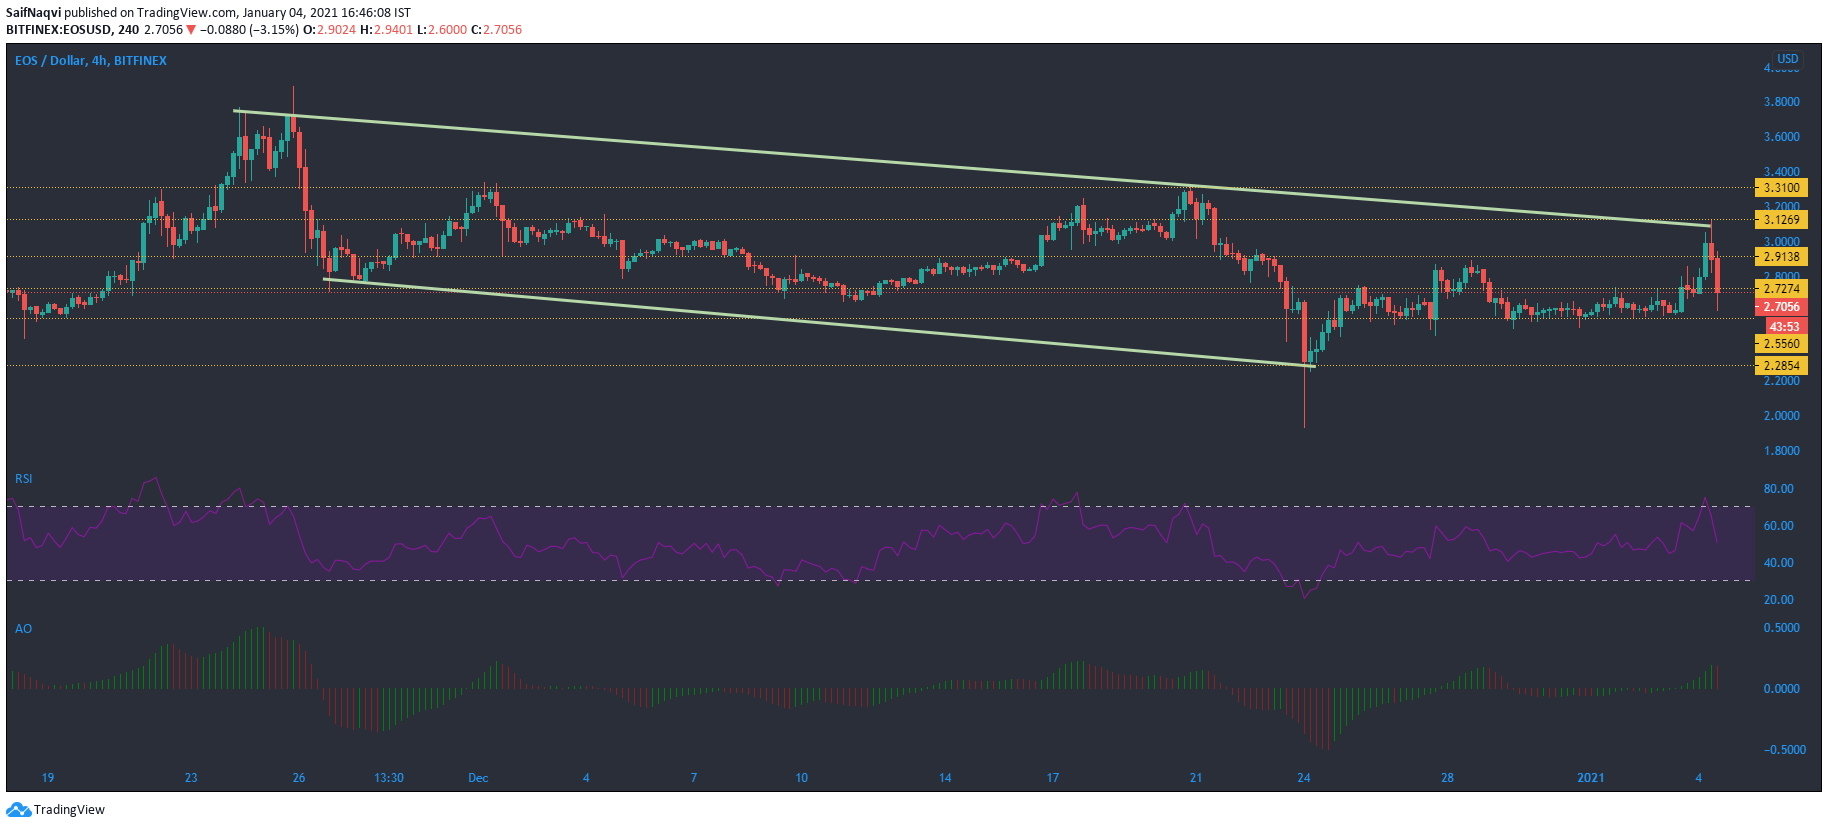
Source: EOS/USD on TradingView
Although EOS was trading between the channels of $2.72 and $2.55 at the start of the year, the price rose above this channel in the past 24 hours. However, the resistance level at $3.12 challenged the price once again and pushed it lower on the charts. The extent of the said fall would be the next focus for investors as indicators suggested that the prices could tumble all the way down to their November lows in the near future.
The Relative Strength Index was sharply moving from the overbought region towards the neutral zone. The proportion of the index’s fall could determine whether the price would test the present support at $2.55, or move even lower towards the next barrier at $2.28.
Even though the Awesome Oscillator registered just a single red bar on the histogram, it indicated that bullish momentum was slowing down and might drag the price into bearish territory.
WAVES
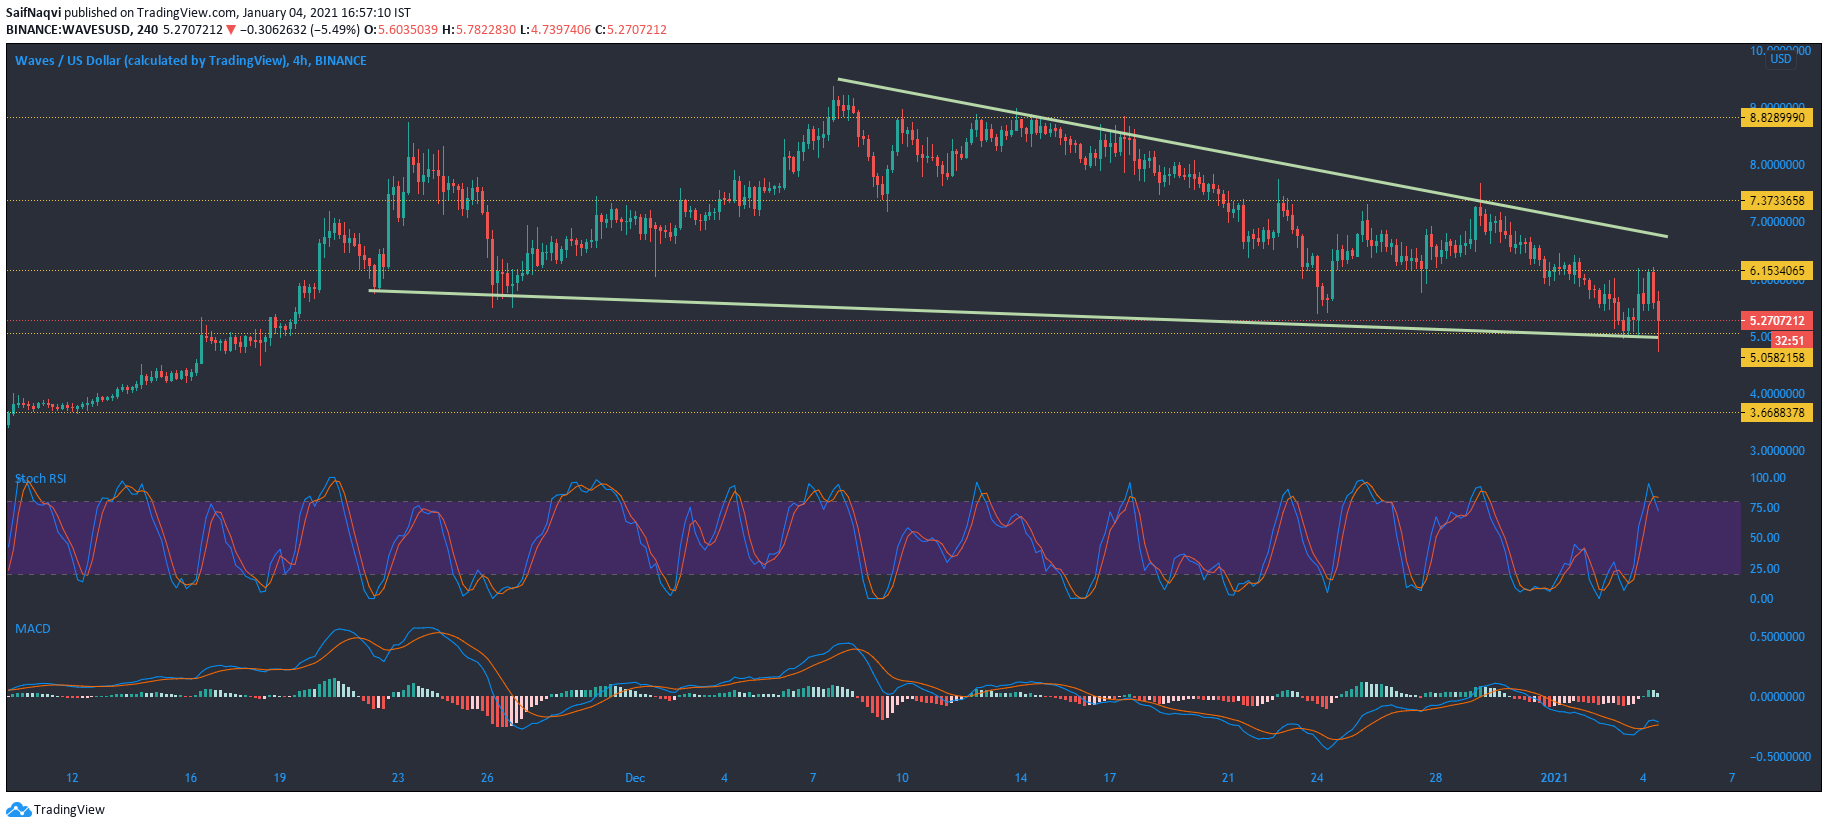
Source: WAVES/USD, TradingView
WAVES has had a rocky start to the year so far, with prices down by over 17% in the past three days. While there was some optimism in the market after Bitcoin climbed on the charts, WAVES reversed course and fell towards the support at $5.05 as selling pressure mounted up once again.
A look at the 4-hour chart showed that WAVES has been on a downtrend since December. With this in mind, investors might have to wait a little longer for a breakout as indicators implied that prices could be bearish in the short-term.
The Stochastic RSI was heading south from the overbought zone and suggested that the bullish momentum was short-lived. The price could move lower to the next support at $3.66, if the index was to continue on its trajectory.
The MACD was on the verge of a bearish crossover as the Signal line looked to rise above the fast-moving line once again.
Crypto.com Coin [CRO]
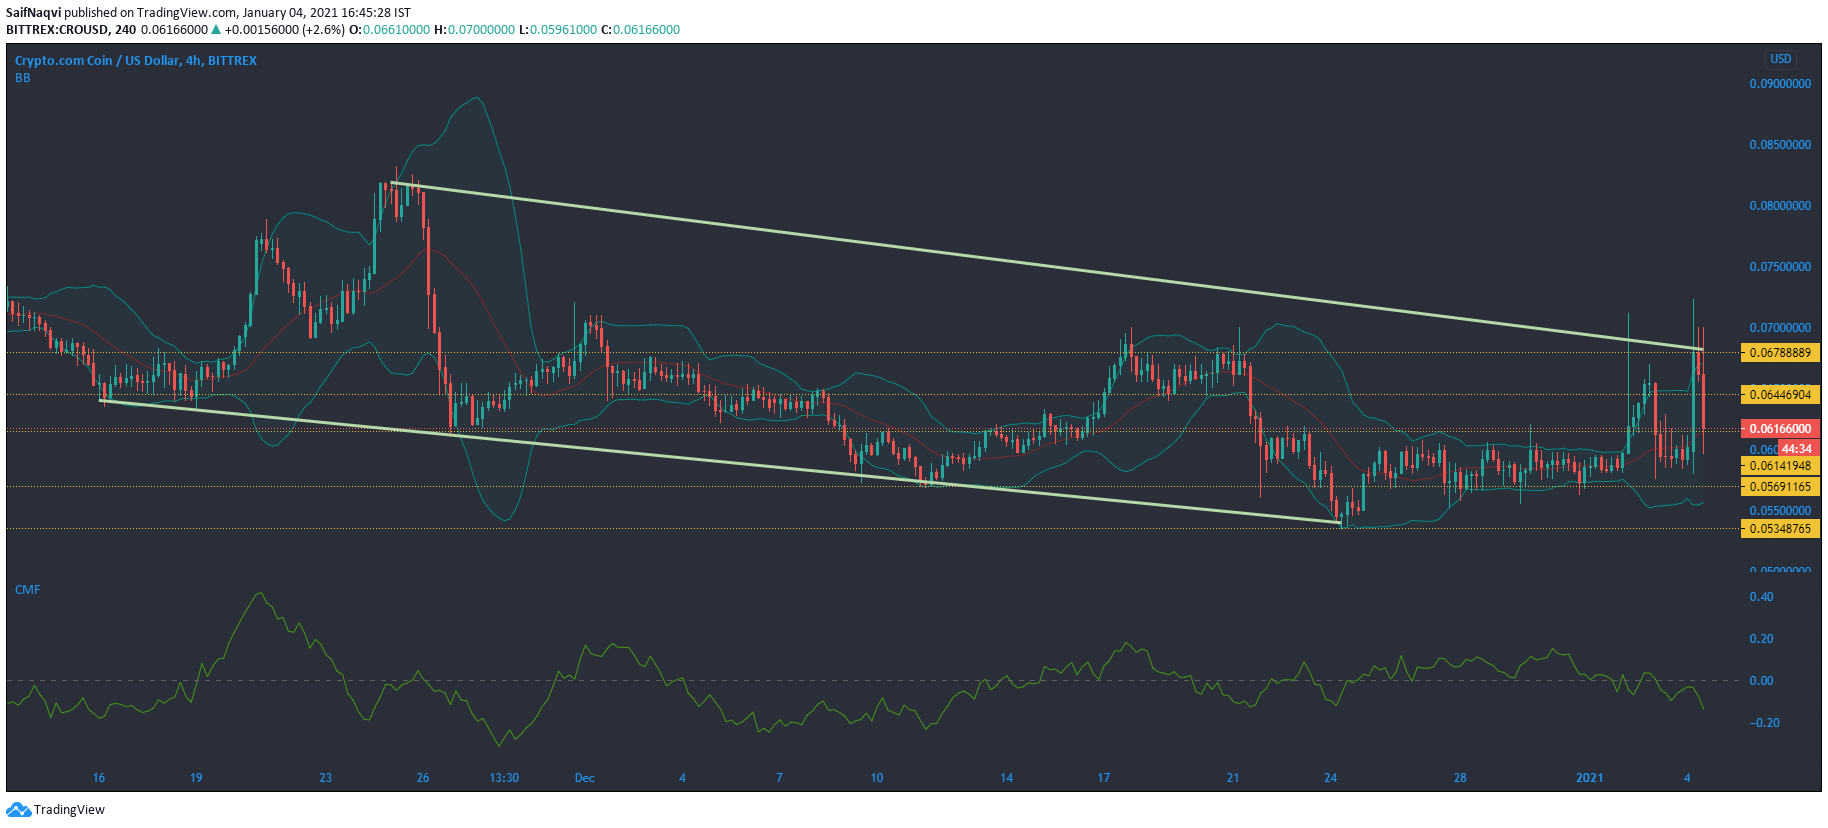
Source: CRO/USD, TradingView
Crypto.com Coin registered dramatic price movements over the past few days. Even though several resistance levels were breached during this timeframe, the cryptocurrency’s price was heading towards the support level at $0.056, at press time.
The Bollinger Bands indicated a high degree of volatility in prices. The price’s candlesticks were moving towards the lower band after trading on the upper band for a few sessions. If CRO is unable to hold the $0.056-support level, it could tumble towards the next available support at $0.053.
The Chaikin Money Flow demonstrated that capital outflows were one of the reasons why the cryptocurrency’s price fell over the past couple of sessions, as the index was moving lower in tandem with the candlesticks.