
EOS was trading between its 50 SMA and 200 SMA, while Waves witnessed a breakout from an ascending triangle formation but was stabilizing at lower levels, at press time. Finally, Zcash cut its losses around the 38.2% Fibonacci level, with the same found at $136.21.
EOS
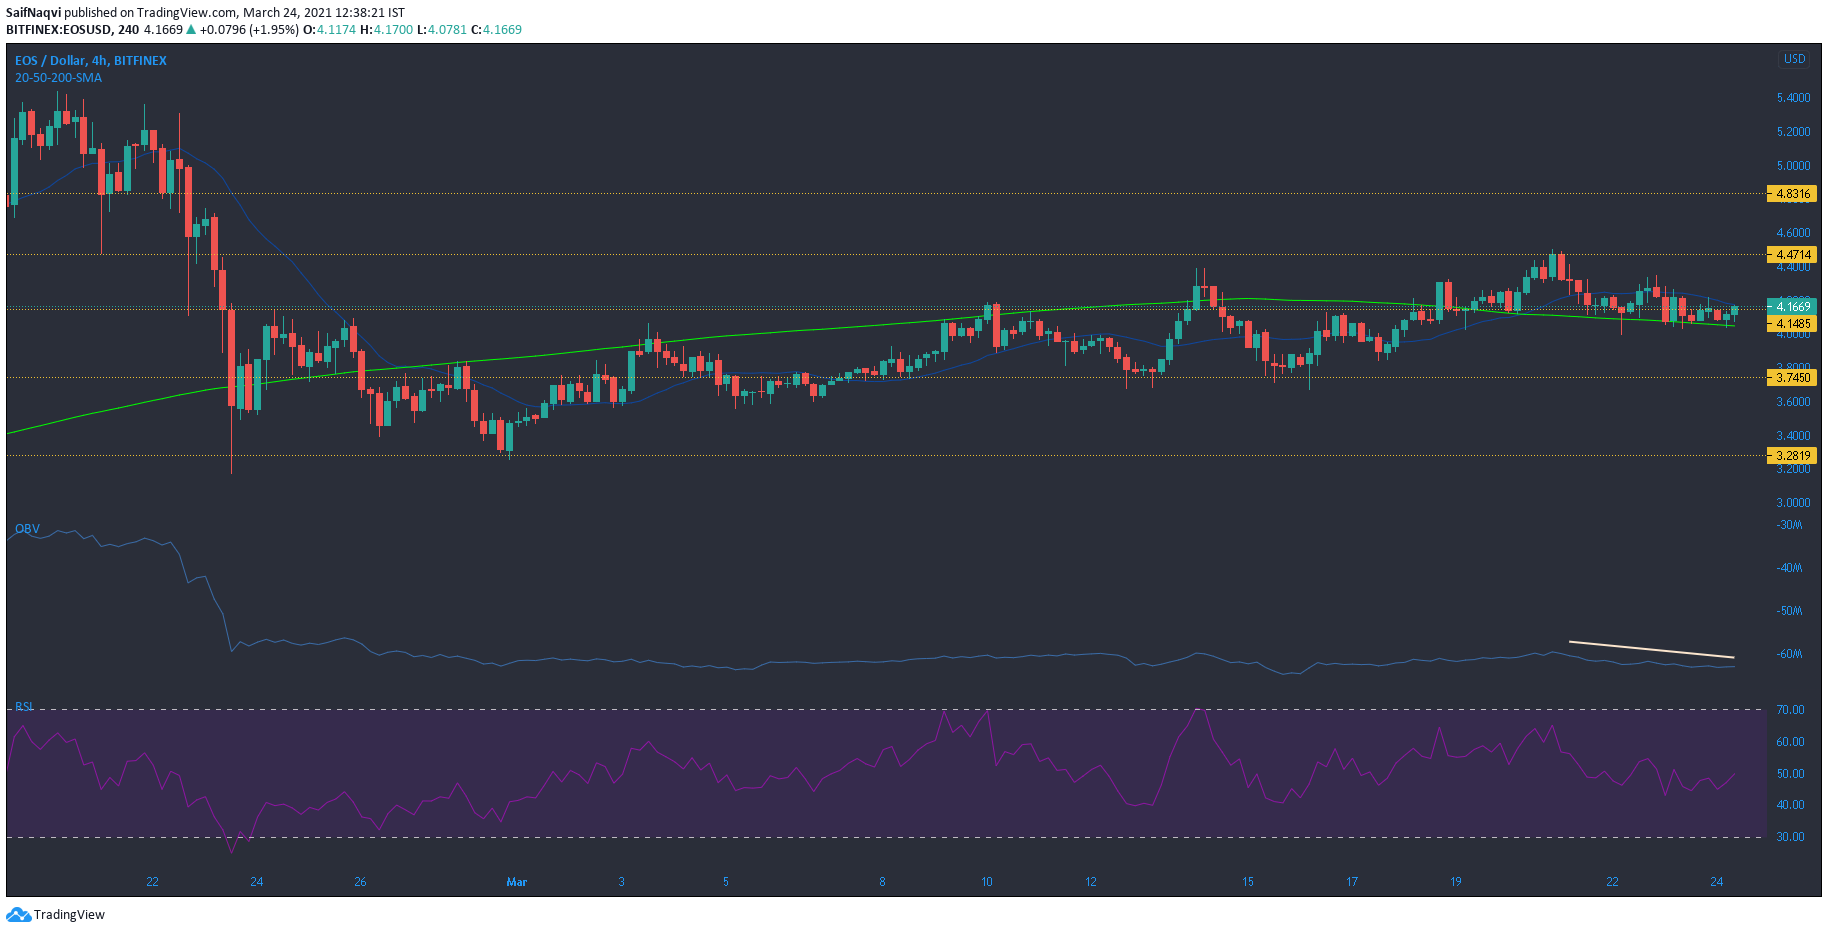
Source: EOS/USD, TradingView
Lower highs on the OBV highlighted selling pressure in the market as EOS moved south from the $4.47-resistance. On the 4-hour timeframe, the candlesticks were sandwiched between the 50 SMA (blue) and 200 SMA (green), both of which acted like resistance and support lines, respectively. A crossover between the two moving averages might also be a bullish development.
The RSI was pointing north from around 50 and a move towards the upper region would likely see EOS flip its overhead resistance. This could allow for additional gains up to the next ceiling at $4.47. On the other hand, a breakdown from the 200 SMA could lead to an extended sell-off to a strong region of support at $3.74.
Waves [WAVES]

Source: WAVES/USD, TradingView
A breakout from an ascending triangle yesterday saw Waves jump above the $12-mark, a level seen for the first time in the last 33 days. However, a sell-off was also witnessed at higher levels and the price moved closer to the $11-support. The 24-hour trading volume jumped by over 110%, clocking in at over $350 million, an indication that traders had likely locked in gains as the price approached $12.
The Stochastic RSI was heading lower from just under the overbought zone, while the MACD’s histogram noted a dip in momentum, even though the MACD line moved above the Signal line. Stabilization at the press time support level would be healthy in the short-term, and the next target for the bulls lay above $13.
Zcash [ZEC]
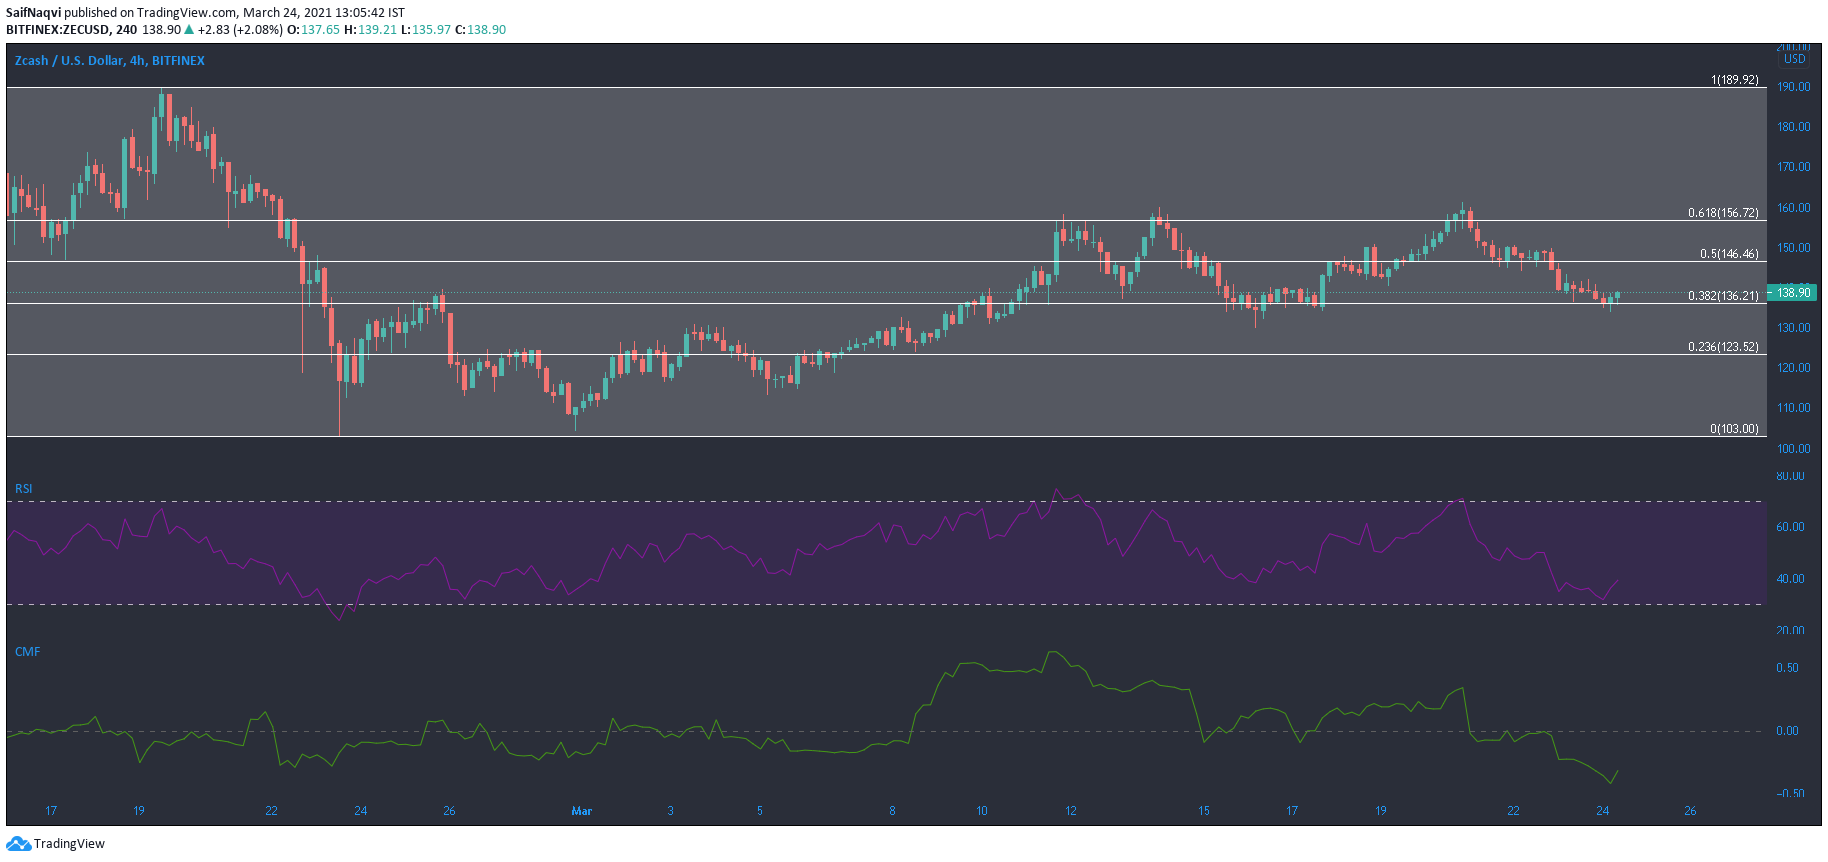
Source: ZEC/USD, TradingView
Some bullish movement was seen on Zcash’s 4-hour chart as the price found support at the 38.2% Fibonacci retracement level. Previously, a fall towards the press time channel had spurred some buying which boosted the price north, and the same was expected moving forward. The RSI picked up from close to the oversold region as ZEC bulls cushioned a sell-off at $136.21.
The Chaikin Money Flow was also pointing north and a move above the half-line could see strong capital inflows for the cryptocurrency, which in turn could push the price above the 50% retracement level.