EOS: Why there’s a question mark attached to its long-term trajectory

Disclaimer: The findings of the following analysis are the sole opinions of the writer and should not be taken as investment advice
The lack of buyers for EOS has certainly hurt its price progression on the chart. Facing strong competition from the likes of Solana, Cardano, and Ethereum, the smart contract operator has gone relatively unnoticed since the wider crypto-crash on 19 May. This was evident from its recent trading volumes which were nowhere near levels seen during its run-up to May highs.
While a bullish pattern did attempt to change this situation, 7 September’s flash crash came at an unfortunate time. Since then, while EOS did regain some lost ground, it was yet to fully convince observers of a speedy recovery.
At the time of writing, EOS was trading at $5.27 with a market cap of $4.94 billion.
EOS Daily Chart
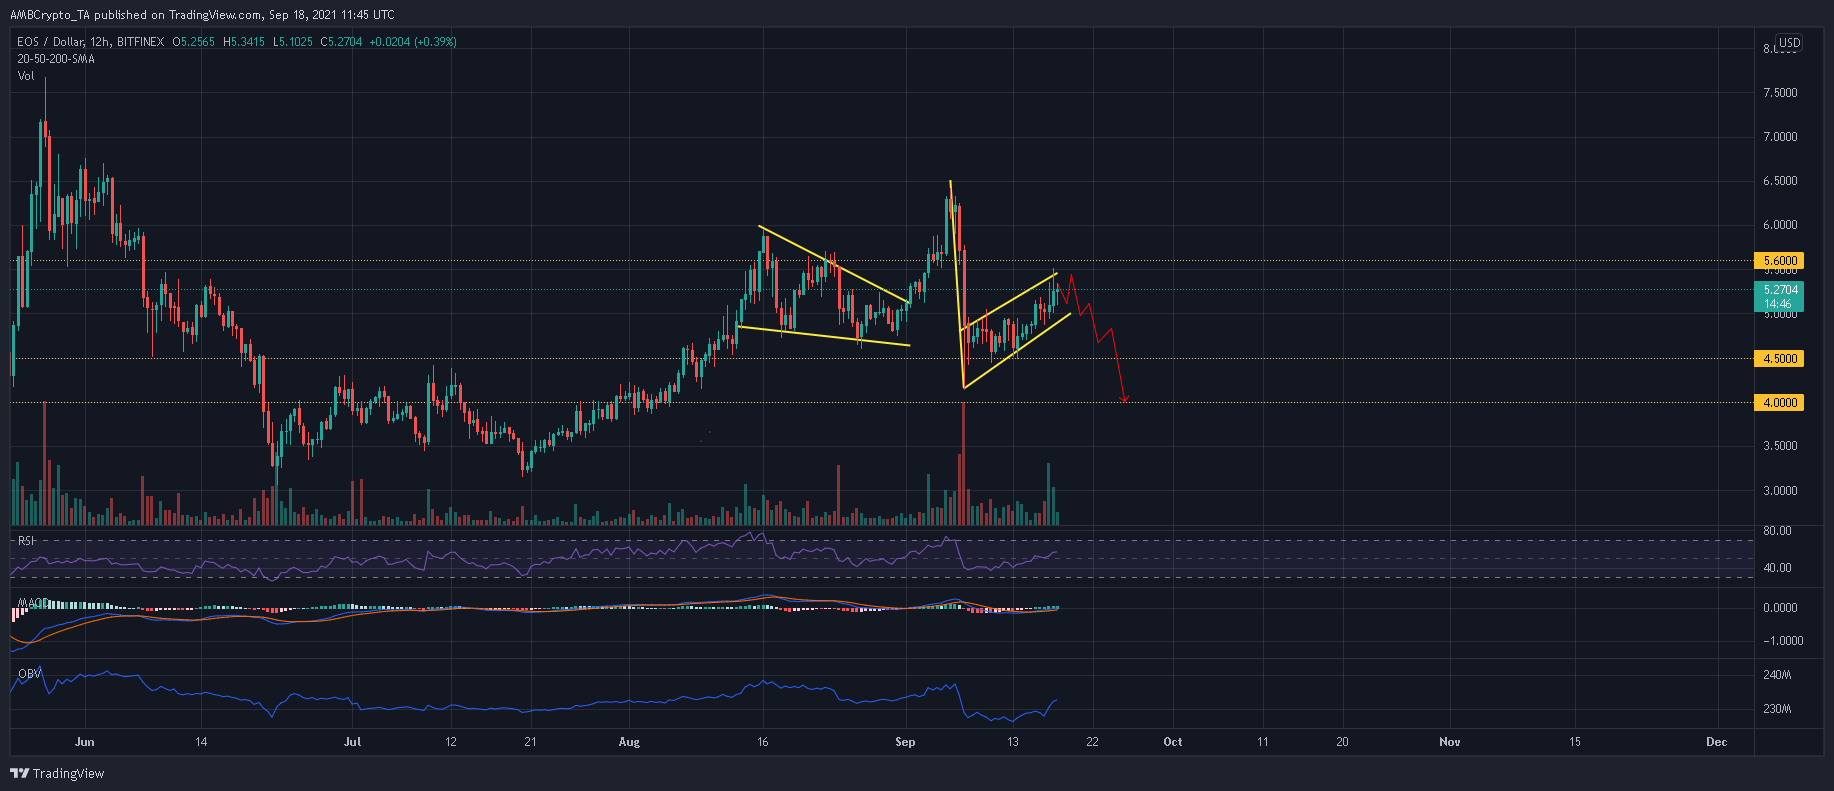
A falling wedge breakout in early September set EOS for higher price levels but 7 September’s flash crash played spoilsport. Since then, EOS began to take shape within a bear flag which presented chances of a breakdown. A close under the daily 20-SMA (red) and the $4.8-support would set EOS on a southbound path below 7 September’s swing low of $4.15.
The support areas of $4 and $3.5 would look to stem further bleeding in the market.
To shatter this outlook, EOS would need to register a close above $5.7 on strong volumes. This would allow the digital asset to target previous highs formed at $6 and $6.4.
Reasoning
Now, the Relative Strength Index has been forming higher peaks over the past week and a half – A positive sign. However, the index is yet to assert itself in bullish territory. In a weak market, the RSI normally finds resistance between 55-60 and drops lower once again.
Similarly, the MACD was inching higher but at a relatively slow pace. A bullish outcome cannot be expected till the index rises comfortably above its half-line. The On Balance Volume presented a wider picture. According to the index’s downtrend, sell volumes have been higher than buy volumes over the past month.
Conclusion
Since EOS was trading within a bear flag pattern, a breakdown can be expected going forward. In such a case, expect buyers to respond at support levels of $3.5 and $4. To overcome this situation, buyers need to maintain EOS within its current pattern. This would heighten the chances of a break in the opposite direction.


