ETC tests $23 resistance yet again- will the outcome be different this time

Disclaimer: The information presented does not constitute financial, investment, trading, or other types of advice and is solely the writer’s opinion.
-A bearish divergence was seen in ETC’s previous attempt.
-The recent consolidation phase could have given bulls time to accumulate.
Bitcoin [BTC] marched past the $30k level after halting there for a couple of days. Lower timeframe charts showed strong bullish momentum, but a pullback could begin if BTC dropped below $30.2k and $29.6k. Ethereum Classic [ETC] noted gains alongside BTC and has climbed by close to 12% from Monday’s lows.
Is your portfolio green? Check the Ethereum Classic Profit Calculator
As ETC approaches a three-month resistance yet again, the likelihood of a breakout appeared better than any of the previous attempts. Volume and momentum favored the bulls more clearly, but will it result in a rally past $23?
Traders can watch out for the development of a divergence
The $23.2 level has posed resistance to the price throughout 2023. In the latter half of January and through February, ETC oscillated between the $23.2 and $20.8 levels of resistance and support. In the past two weeks, the $20.8 level, which had been resistance, was convincingly broken.
The RSI was at 65 and showed strong bullish momentum, and the CMF at +0.23 showed heavy capital flow into the Ethereum Classic market. The buying pressure was evident, and the lower timeframes, such as one-hour, retained a bullish structure.
Traders can anticipate two scenarios- another rejection at the $23.2-$24.2 resistance zone, or a breakout. Cautious traders can remain sidelined and look for a flip in structure on the lower timeframes to short the asset.
Greed was the sentiment across the crypto market, but a quick price dump could cause large liquidations and feed right into the buy orders of larger market participants.
It was unclear where ETC could go, but risk-averse traders can wait for a few days for a breakout past $23.2 and acceptance before looking to bid.
Realistic or not, here’s ETC’s market cap in BTC’s terms
Buying pressure was in decline – will this force a reversal?

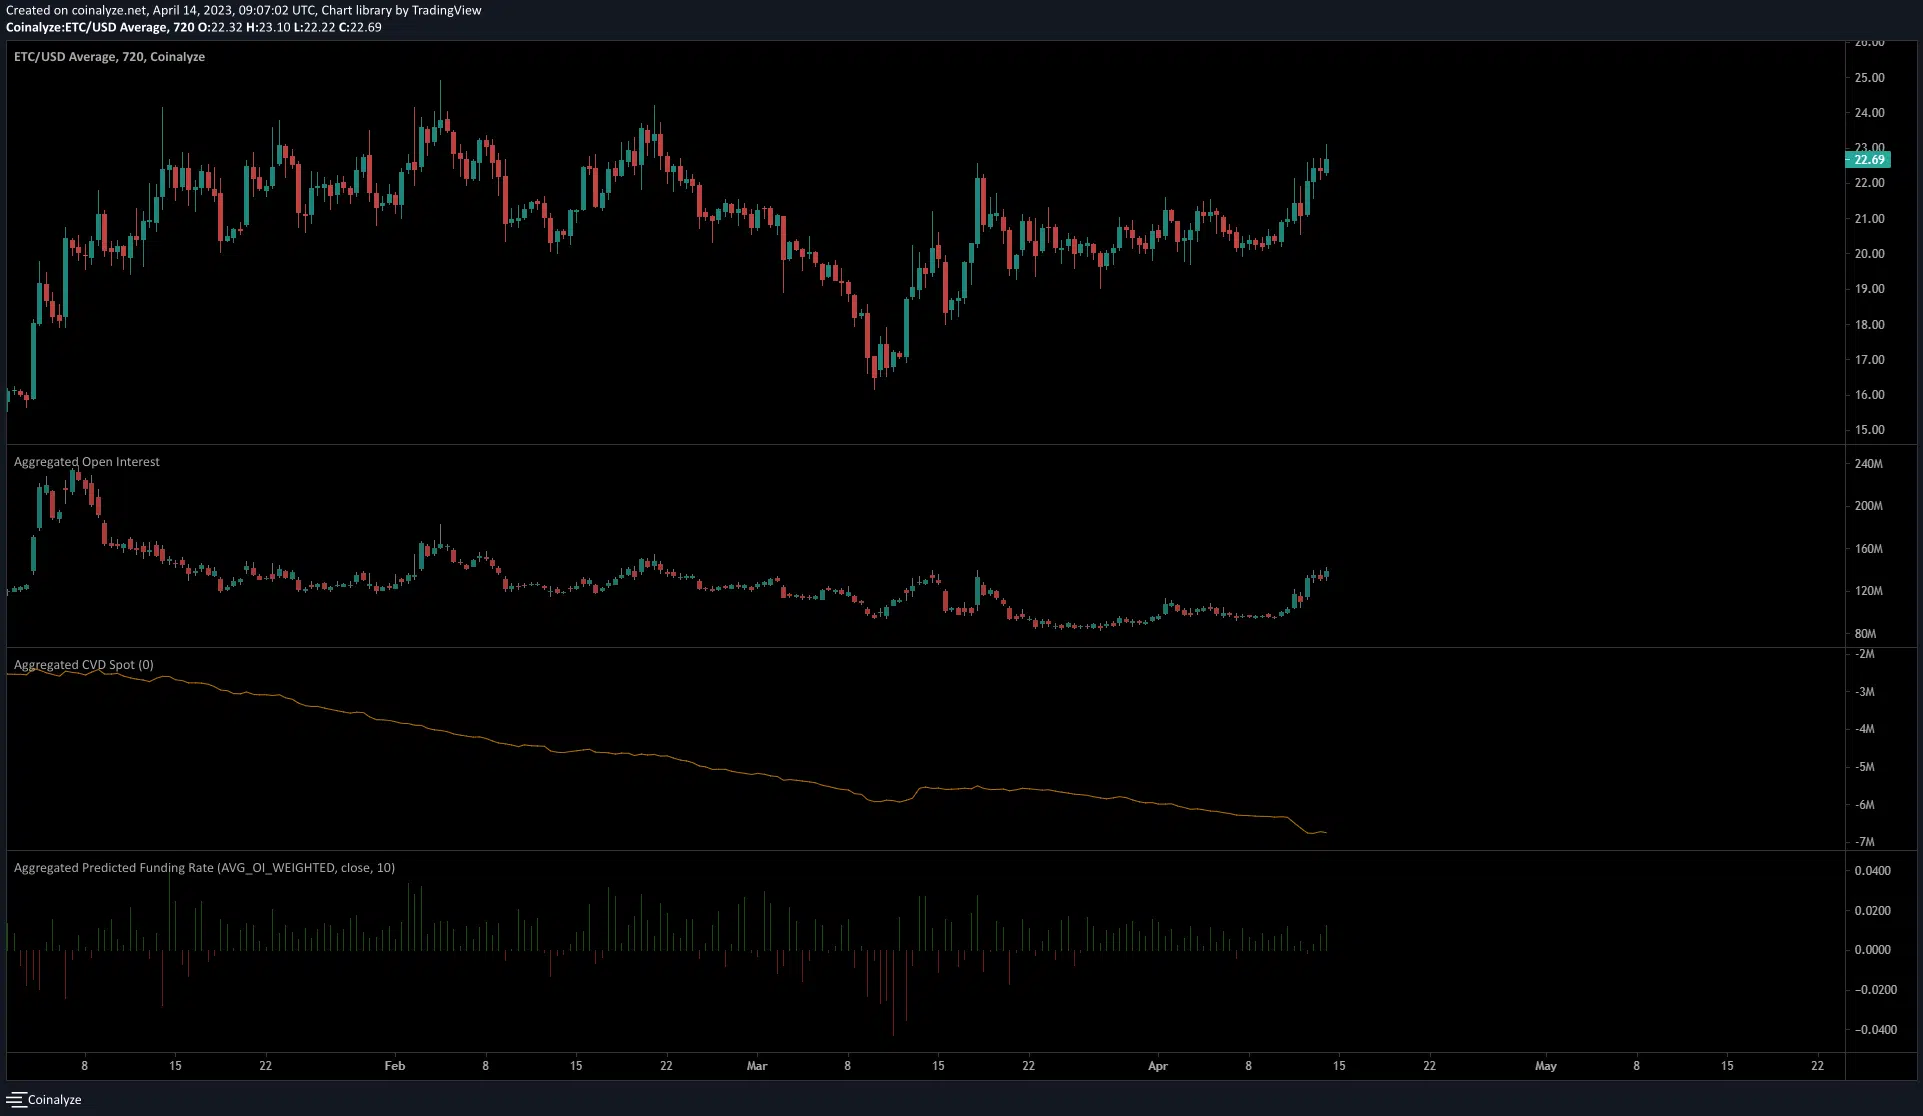
Source: Coinalyze
Although traders can look to bid in the event of a breakout and retest, the spot CVD on the 12-hour chart from Coinalyze continued to be in a downtrend in the past two months. Meanwhile, the OI saw gains to reach the $140 million mark, which was where the bulls lost their strength in early March.
The funding rate was positive, but weakly so, and overall pointed toward bullish sentiment. Overall, the bias wasn’t strongly bullish on the higher timeframes, as it highlighted that traders must be prepared for rejection as well.


