ETH could see a small bounce from $1180, but can traders expect an uptrend

Disclaimer: The information presented does not constitute financial, investment, trading, or other types of advice and is solely the writer’s opinion
- Ethereum sinks into a bullish order block on the daily timeframe
- Traders can wait for a reaction on lower timeframes before entering any trades
Ethereum shed nearly 14% in three days last week to drop from $1355 to $1166. Bitcoin also held on to a level of support at $16.6k over the weekend. Lower timeframe traders can look to trade a breakout in either direction.
Read Ethereum’s [ETH] Price Prediction 2023-24
It was not yet clear in which direction ETH could be headed. The bullish case was more likely, but traders must plan for a plunge beneath $1155 as well. Even in a bullish scenario, there was significant resistance once again at the $1350 belt.
Ethereum slips beneath the mid-range but there is hope yet for bulls
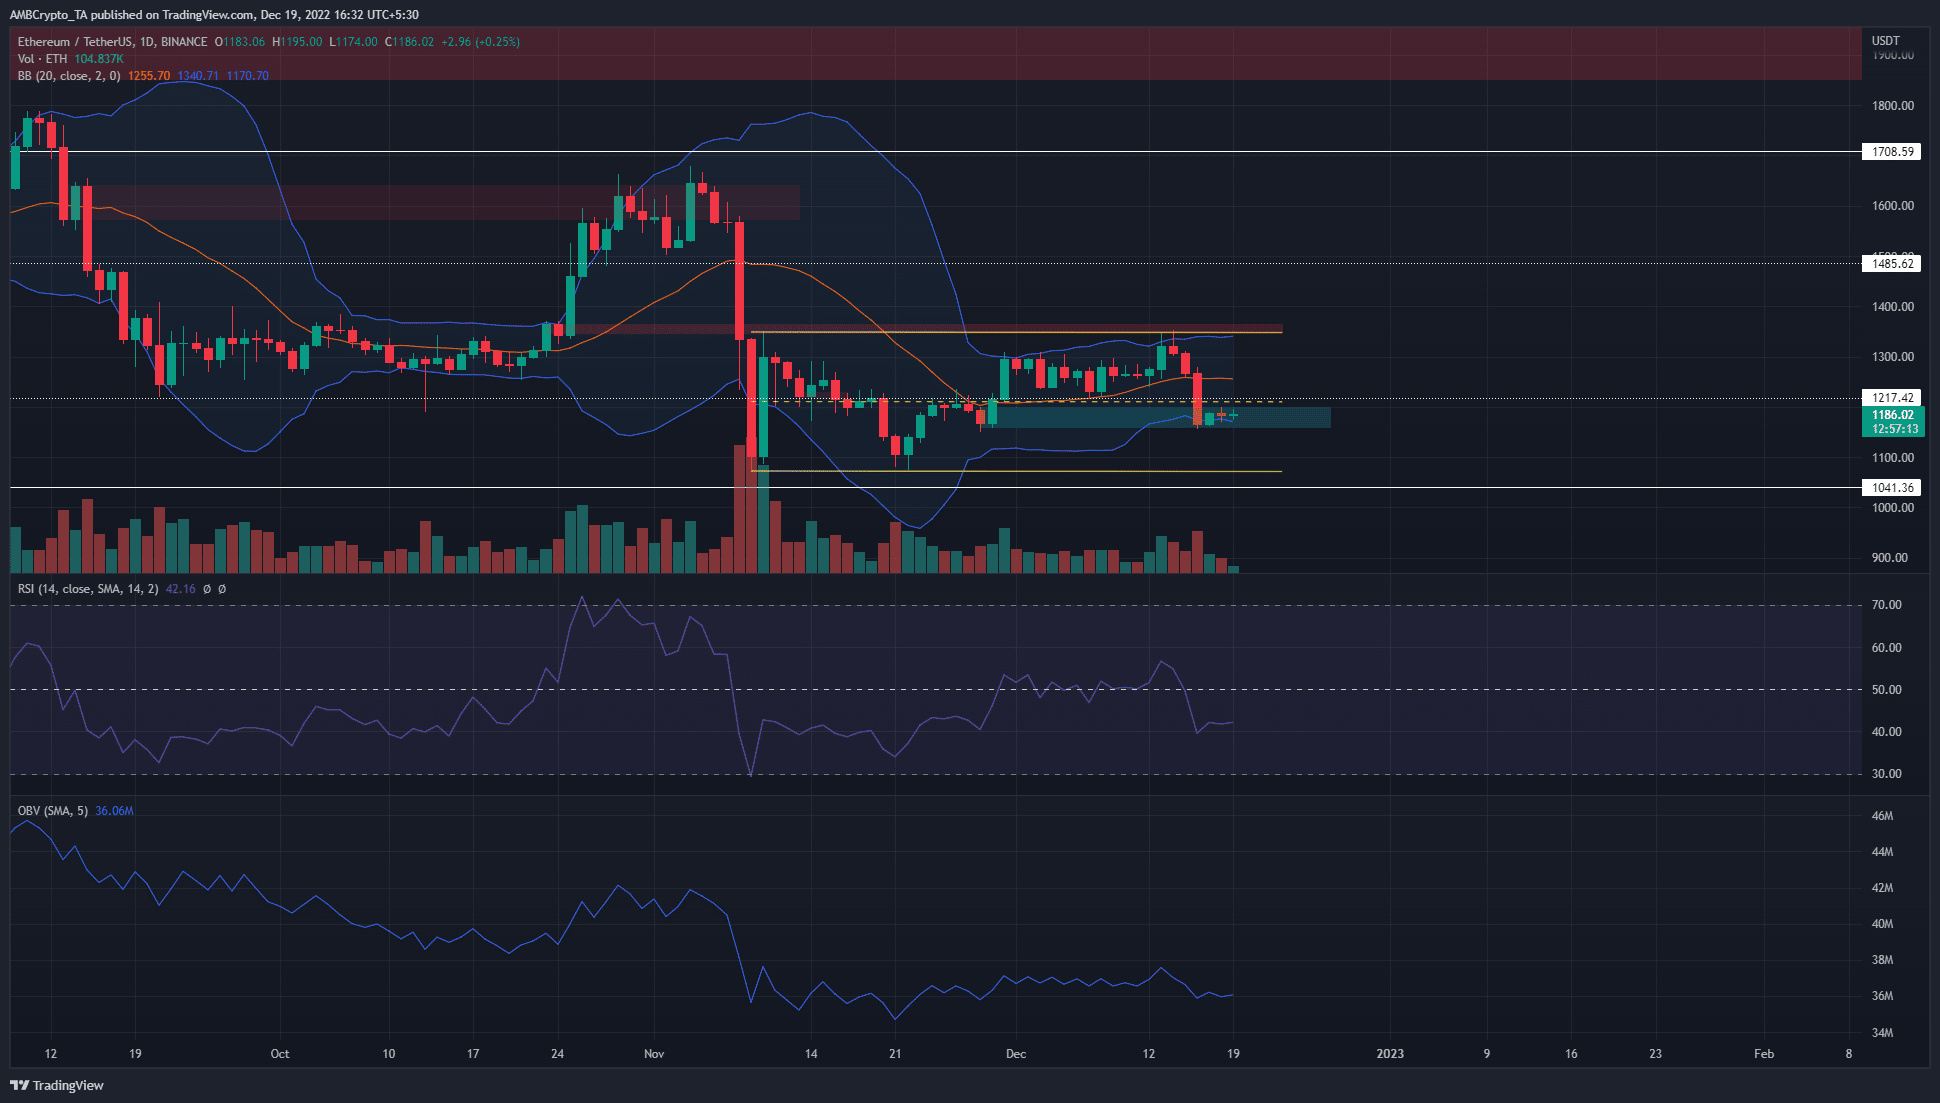
Ethereum has traded within a range since 10 November. This range extended from the low at $1073 to the high at $1348, with the mid-point at $1211. The mid-point also has confluence with a horizontal level of support at $1217. At the time of writing, ETH was trading beneath both these levels.
However, it has some support from the bullish order block formed on the daily timeframe late in November. The lower band of the Bollinger Bands was also at $1170 at press time. The $1160-$1180 can provide a bullish reaction in the next day or two. Meanwhile, a daily session close beneath $1155 would indicate that ETH was headed toward the lows of the range.
Therefore, ETH buyers can wait for a bullish market structure break on lower timeframes to enter long positions.
The Bollinger Bands were not tight around the price. However, they have reduced their width considerably in recent days. This was in response to the lower volatility ETH has seen in December. The Relative Strength Index (RSI) stood just above the 40 mark to indicate momentum was weakly bearish.
The On-Balance Volume (OBV) has also been within a range over the past month, which meant neither buyers nor sellers had the upper hand in recent weeks.
Open Interest declines in December to highlight weakness from buyers
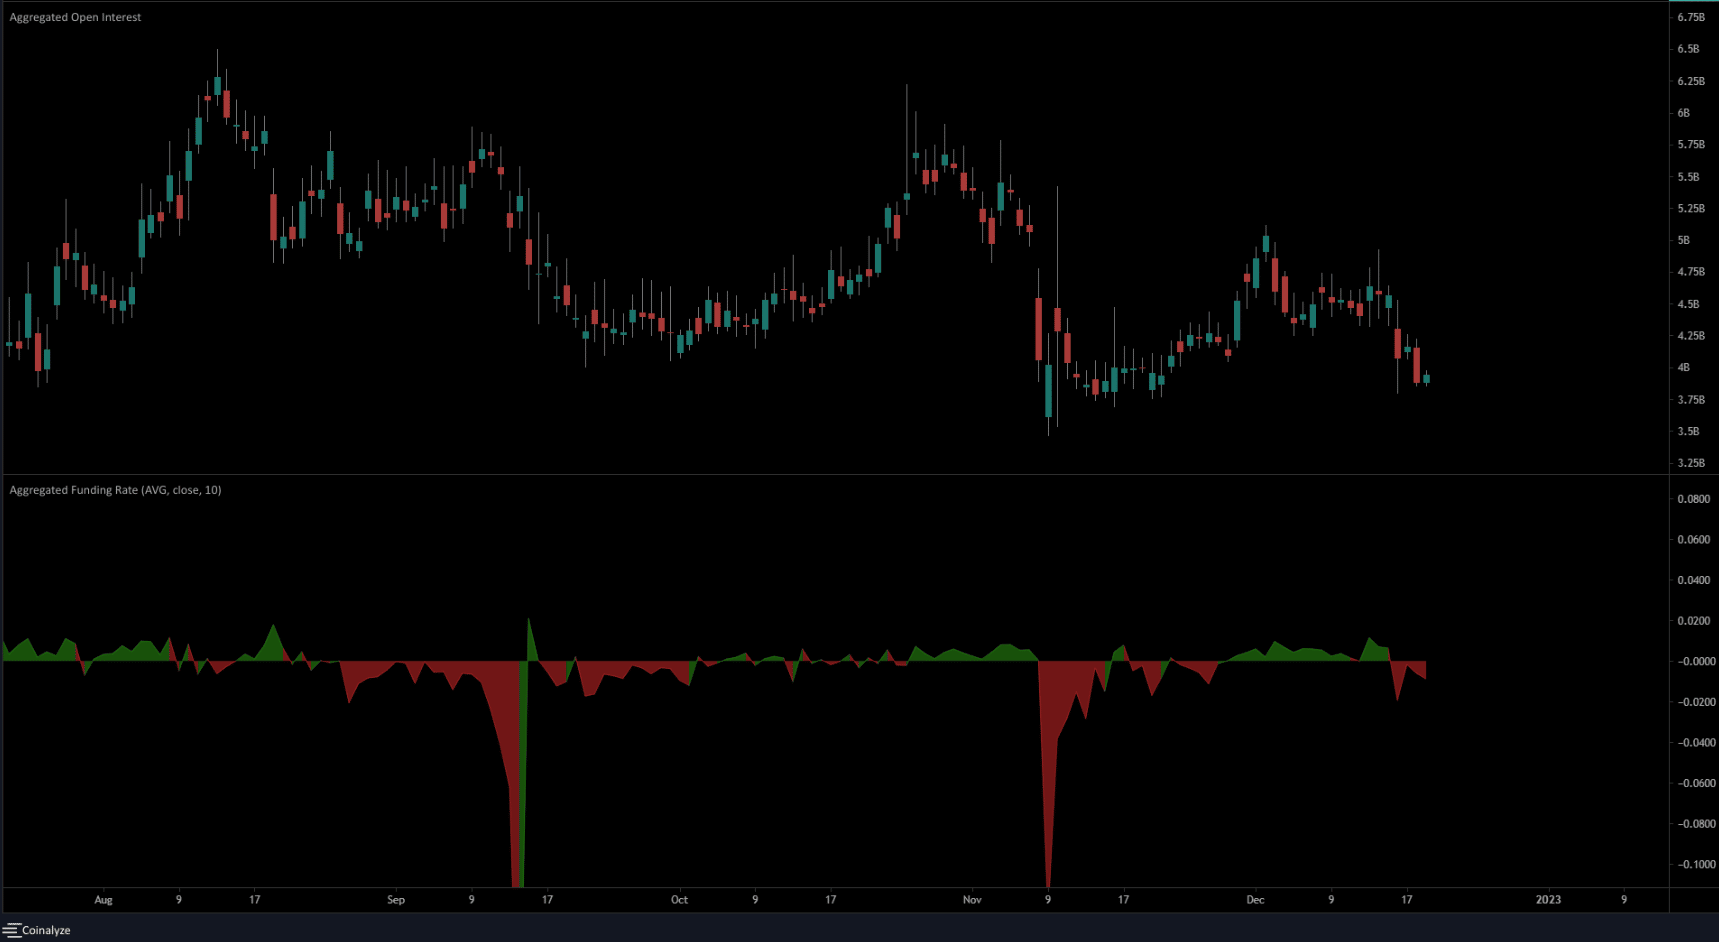
Even though Ethereum ascended to touch the range highs on 13 December, the Open Interest had declined from the beginning of the month. This suggested that buyers were not dominant and the trend was weakening. The OI continued to decline over the past few days alongside the price. This showed discouraged buyers.
The funding rate was also in negative territory to outline bearish sentiment was stronger in the past few days. This could begin to change if Ethereum can reclaim the $1217 mark as support.