ETH makes a fresh start in Q3, but traders need to be alert

- Etheruem’s witnessed an 82% surge in its quarterly fees.
- ETH’s RSI and MACD indicators indicated that there was some ongoing bullish relief for the altcoin
The start of Q3 2023 came with some good news for the altcoin market. This was because most altcoins stepped into the third quarter with some strong bullish strides. As per data from CoinMarketCap, Ethereum [ETH] was also exchanging hands 3.93% higher in the last 24 hours.
To add to the growing price of ETH, a tweet from IntoTheBlock also highlighted a significant update from Q2. As per the tweet, ETH’s quarterly fees witnessed an 83% growth over Q2 of 2023. Additionally, the tweet also highlighted that speculation around meme tokens could be the driving factor for the growth in the ETH fees.
Read Ethereum’s [ETH] Price Prediction 2023-24
New hopes for a new quarter
A look at Ethereum’s performance on the NFT front painted quite a positive picture. As per data from CRYPTOSLAM, ETH’s NFT sales volume witnessed a surge by 129.90% over the last seven days. Furthermore, the network also saw a 25% surge in buyers and a 23% surge in sellers along with the wash volume up by almost 79%.
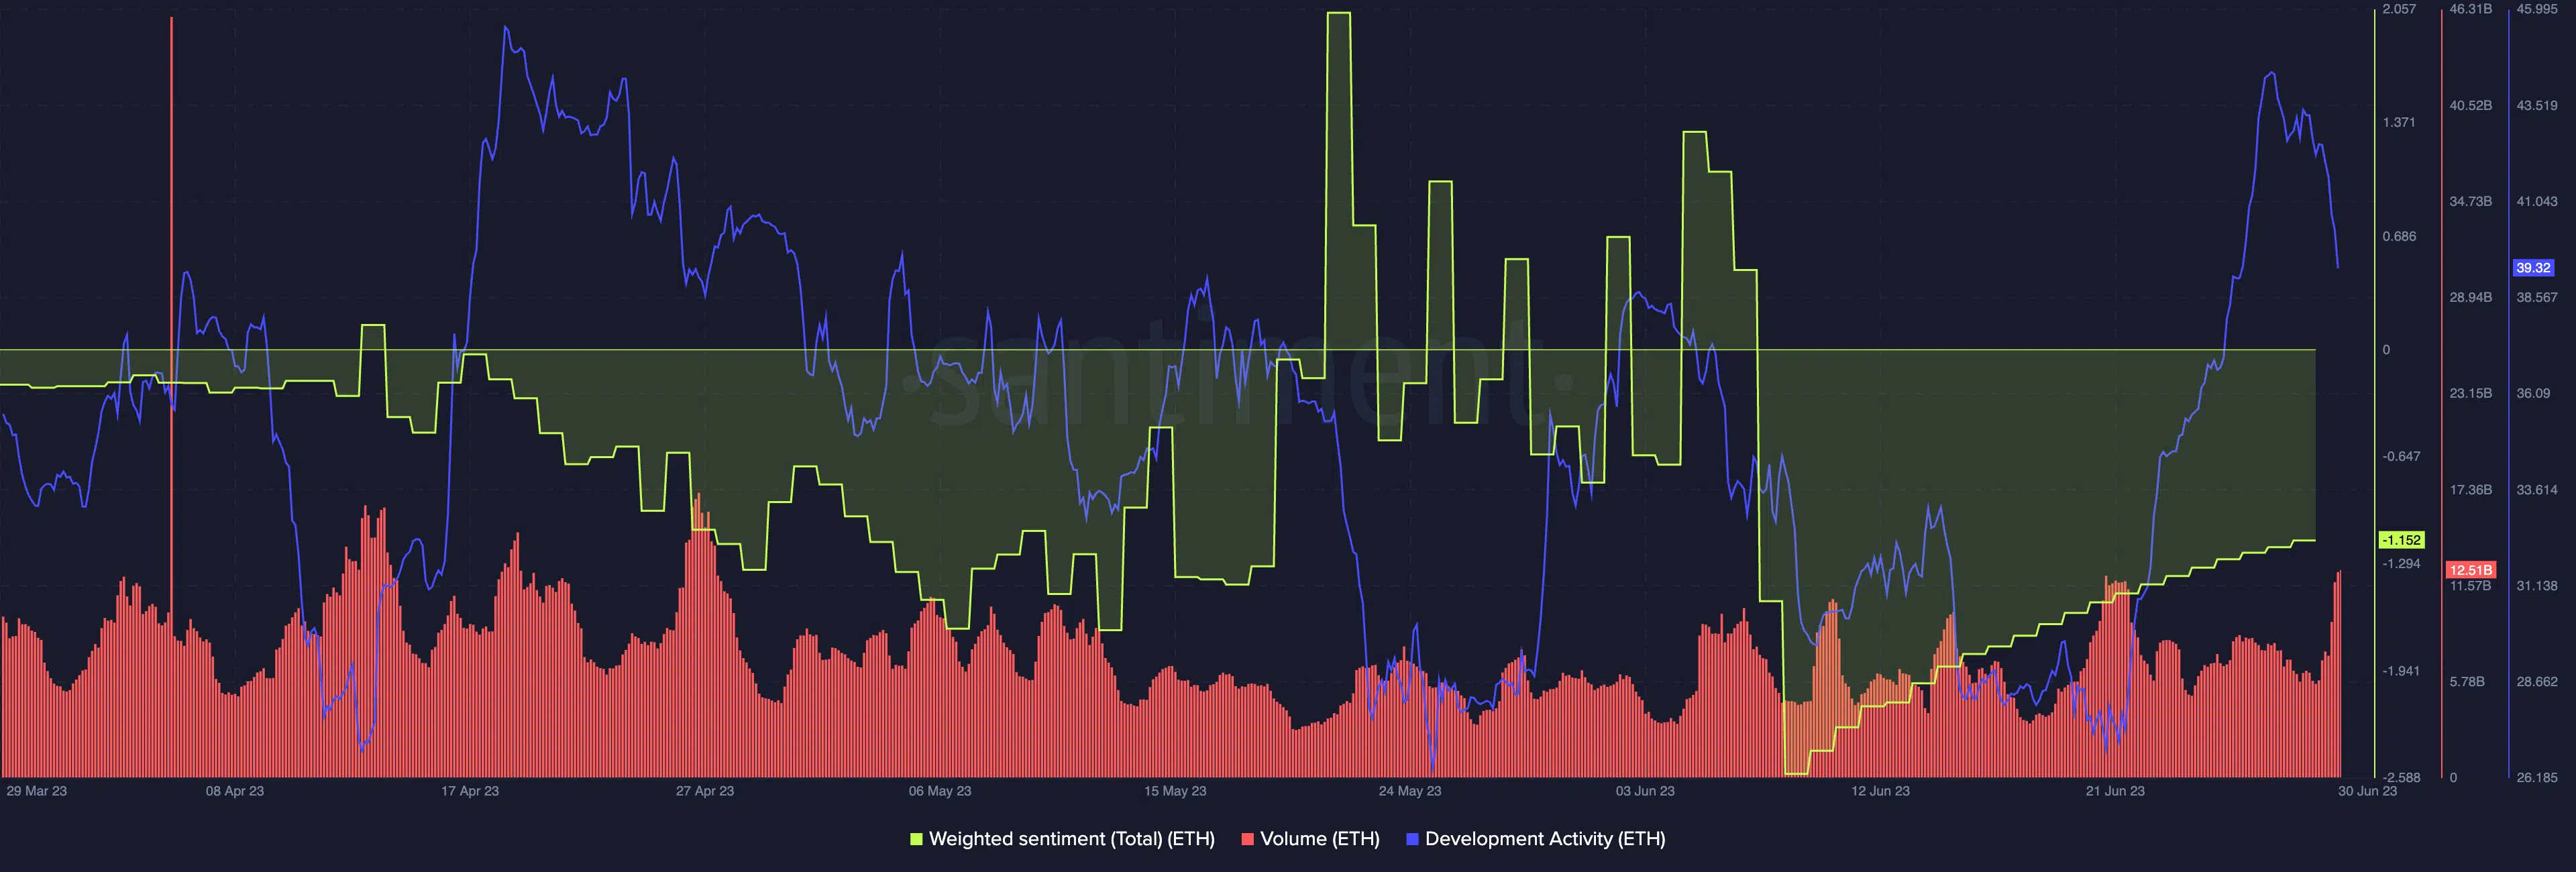
Furthermore, data from the intelligence platform Santiment depicted that the development activity metric could use some effort from the developer end. This was because, at press time, ETH’s development activity stood at 39.32, which was strikingly lower considering the trend over the last few days.
However, ETH’s volume witnessed a spike as of 30 June. A rise in the volume along with a price movement in the positive direction could indicate a sign that investor were accumulating the altcoin. Furthermore, the weighted sentiment towards ETH also showed slow but steady improvement since touching a bottom on 9 June.
Who sides with ETH?
A tweet posted by the Ethereum Fear and Greed Index stated that the investor sentiment in the market was that of greed as the number stood at 55. However, does ETH’s daily chart reflect the same?
At press time, ETH was trading 4.22% higher than its opening price for the day. Additionally, looking at the position of ETH’s Relative Strength Index (RSI), it could be stated that there was significant buying pressure in the market. This was because ETH’s RSI stood at 60.25 and was seen moving towards the overbought zone.
How much are 1,10,100 ETHs worth today
Additionally, ETH’s Moving Average Convergence Divergence (MACD) line (blue) stood above the signal line (red) above the zero line. This indicated a strong bullish movement for ETH. However, despite the bulls supporting ETH as of 30 June, traders should maintain caution.
This was because ETH’s Awesome Oscillator (AO) flashed red bars above the zero line. A slight dip in the buying pressure may drive changes to the position of the indicators and a price correction for ETH.


