Ethereum, Bitcoin SV, FTX Token Price Analysis: 10 January

Ethereum breached the $1300 mark and was inching closer to its ATH as bullish momentum picked up in the shorter timeframe. Bitcoin SV shot up to $320 but faced some selling pressure and could see a pullback. FTX Token showed a likelihood of reaching an upside target of $12.5.
Ethereum [ETH]
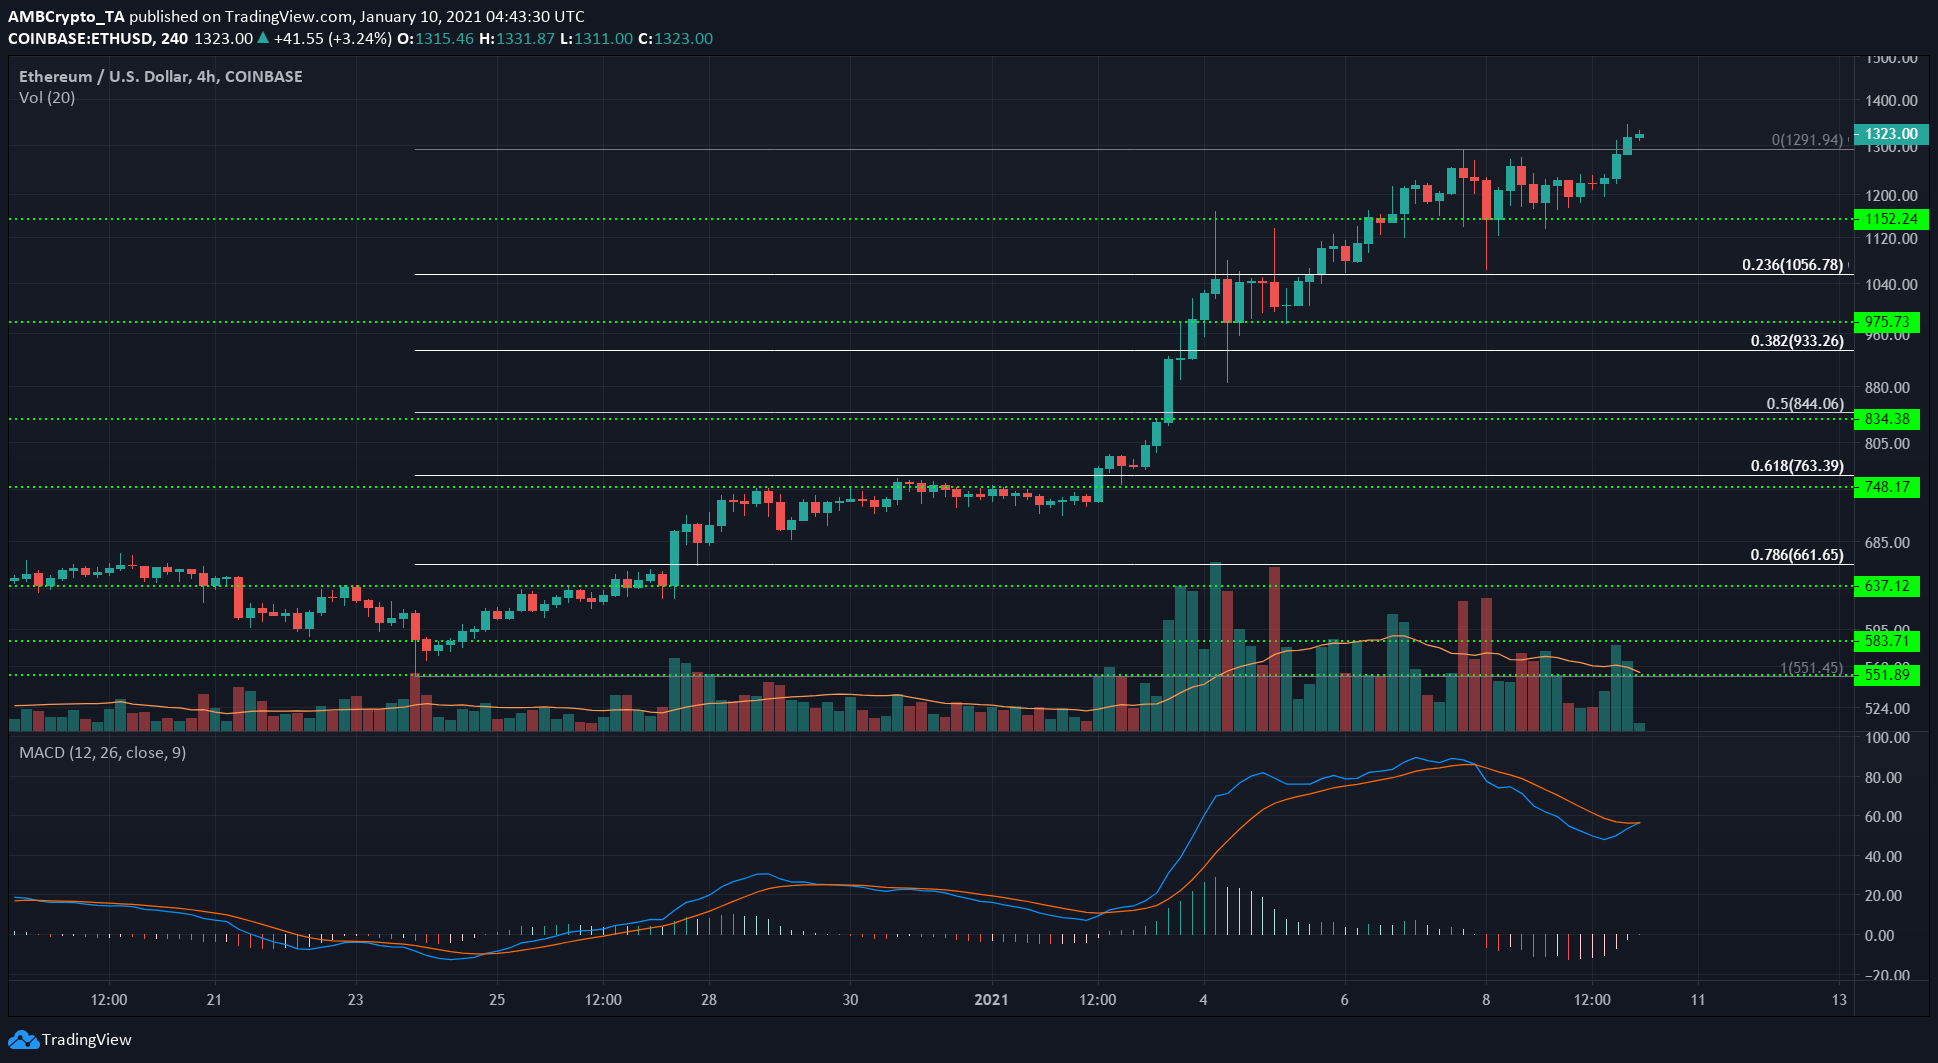
The move from $551 to set a local high at $1291 for ETH has a 27% Fibonacci extension level of $1625. This is the target for Ether over the next few days as it rises past its previous local high.
The MACD was on the verge of forming a bullish crossover and would indicate that strong upside momentum behind ETH was present once more.
In other news, 2% of all ETH supply – amounting to $300 million – was staked in ETH 2.0, a development Vitalik Buterin described as “the ultimate bet on progress”.
Bitcoin SV [BSV]
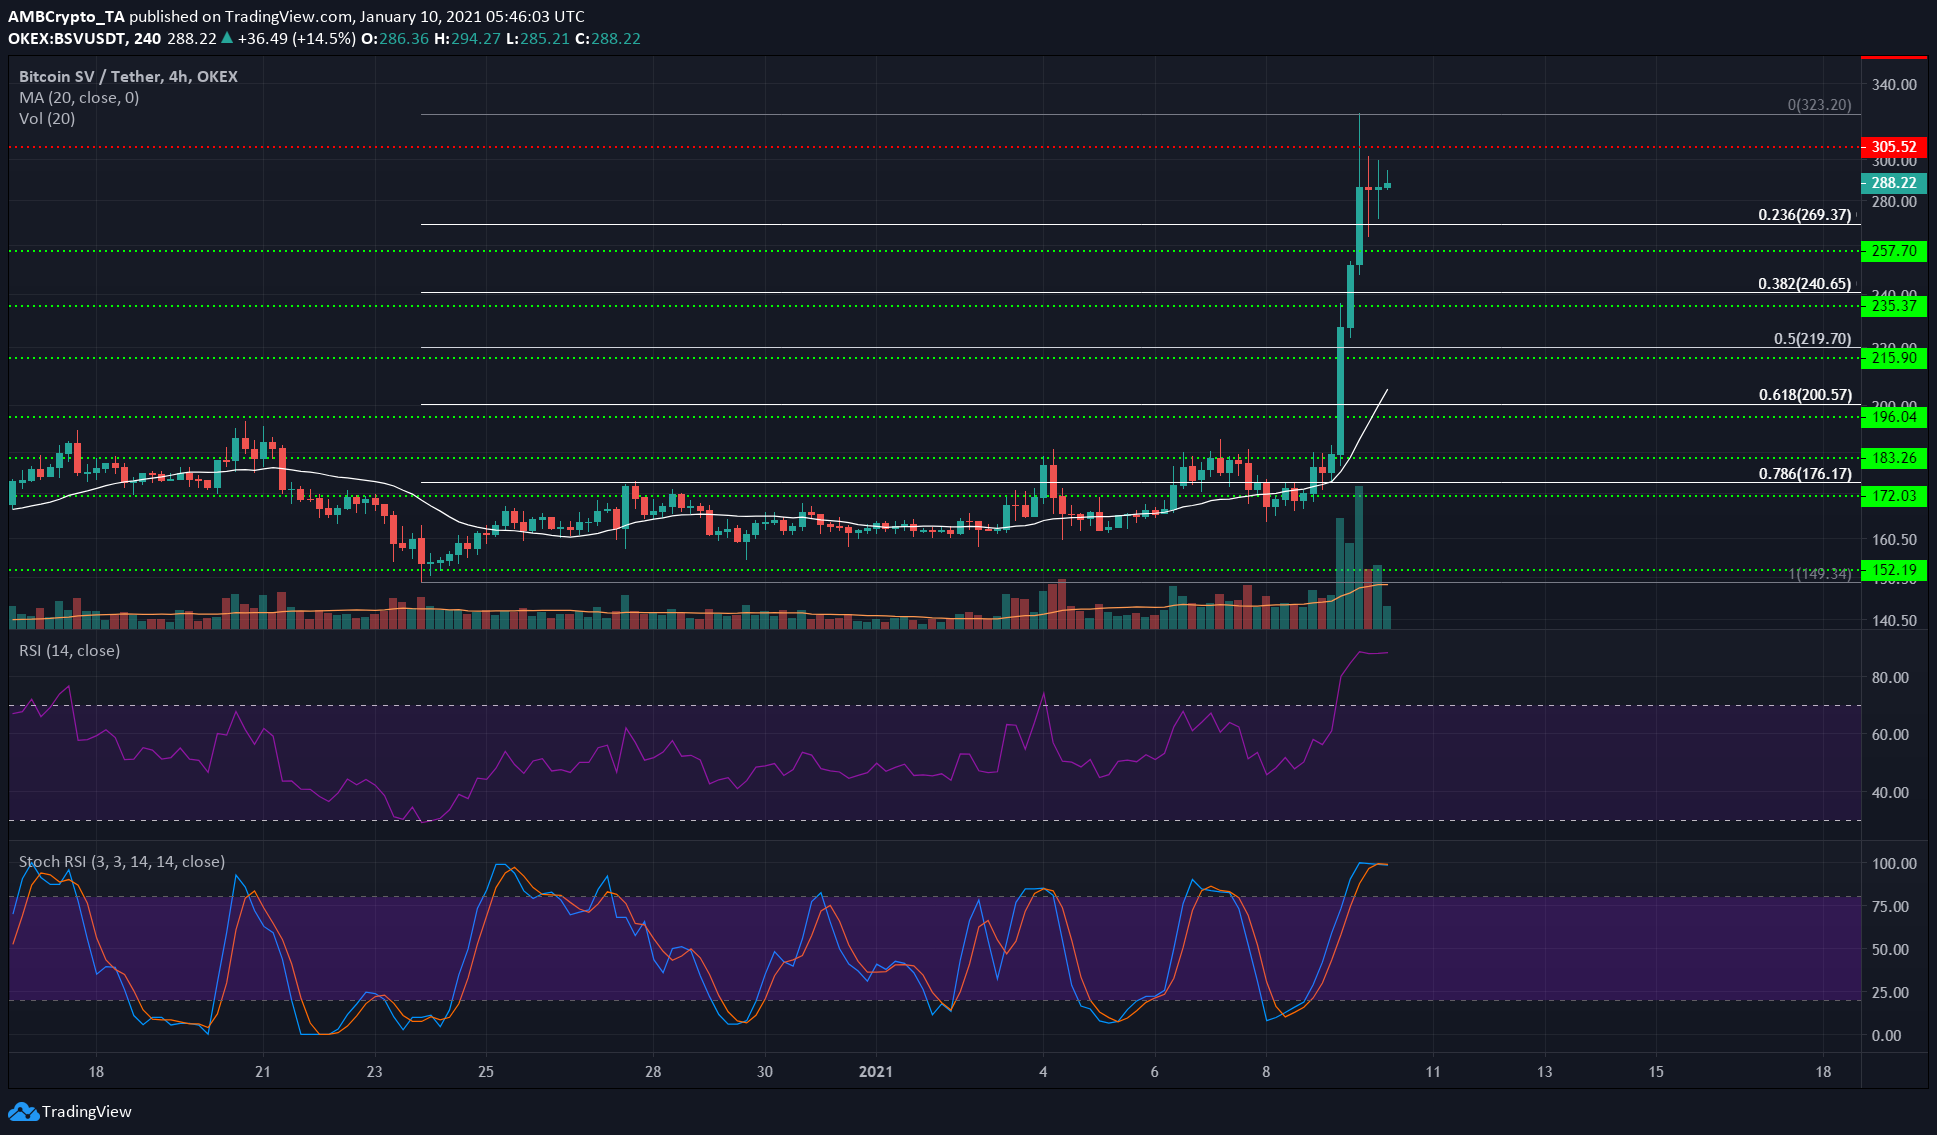
BSV gained 40% in value over the past 36 hours. The 20 SMA (white) was a long distance from where BSV was trading at and, alongside strong volume, signaled the strength of the surge.
The momentum indicators RSI and Stochastic RSI showed that the digital asset was oversold in the 4-hour timeframe.
This does not necessitate a pullback by itself, however, the past few hours saw BSV face selling pressure at $320 and has formed a couple of indecisive candles since.
If BSV continues to be indecisive beneath the psychological $300 mark, it would indicate that the upside momentum has stalled and the levels highlighted by the Fibonacci retracement tool can be expected to act as support.
FTX Token [FTT]
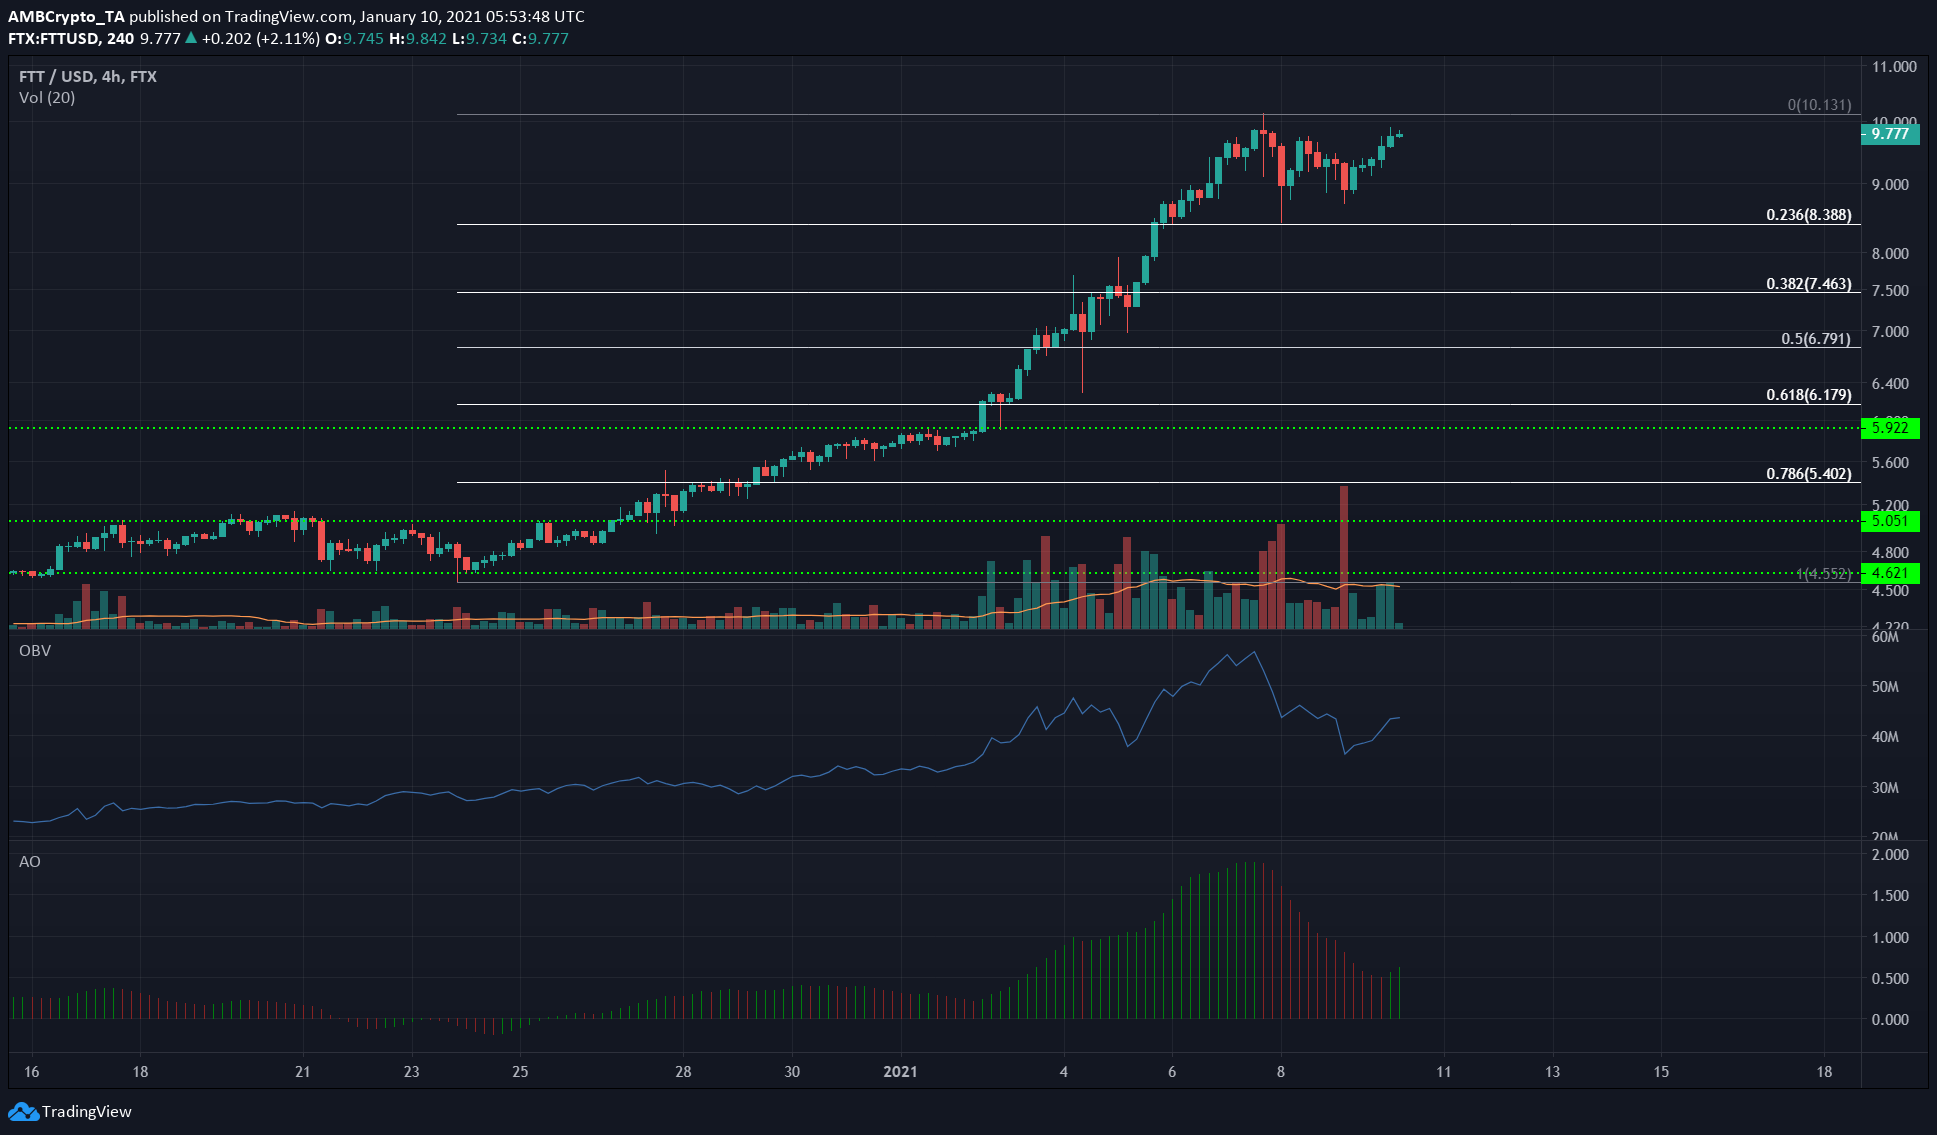
The OBV showed steady buying volume behind the exchange token. Just as the OBV threatened to form a series of lower lows over the past couple of days, buyers stepped in.
The Awesome Oscillator showed that the bullish momentum behind FTT was rising once more. The 27% Fibonacci extension gives a target of $12.5 for FTT if it climbs above $10.1.
If the AO forms a lower high over the next few days, it would set up a bearish twin peaks scenario and give a sell signal, and dips would likely represent an opportunity to buy.