Ethereum: Bulls and bears tussle for the range-low
Ethereum consolidated losses near the $1830 level, but bearish pressure still looms large.

Disclaimer: The information presented does not constitute financial, investment, trading, or other types of advice and is solely the writer’s opinion.
- ETH’s price action remained below the 12-hour chart order block.
- A breach of the range-low ($1828) could tip ETH to sink lower.
The king of altcoins, Ethereum [ETH], has remained below a key roadblock since late July. Despite analysts’ mixed views on the altcoin’s “weak” price action, sellers seemed poised to seek more ground in the short term. ETH consolidated near the range-low and support of $1828 over the weekend (5-6 August).
Read Ethereum’s [ETH] Price Prediction 2023-24
In the meantime, Bitcoin [BTC] struggled to hold on to the $29.0k mark, further entrenching the idea of sellers’ edge over the weekend.
A rebound or extra slump?
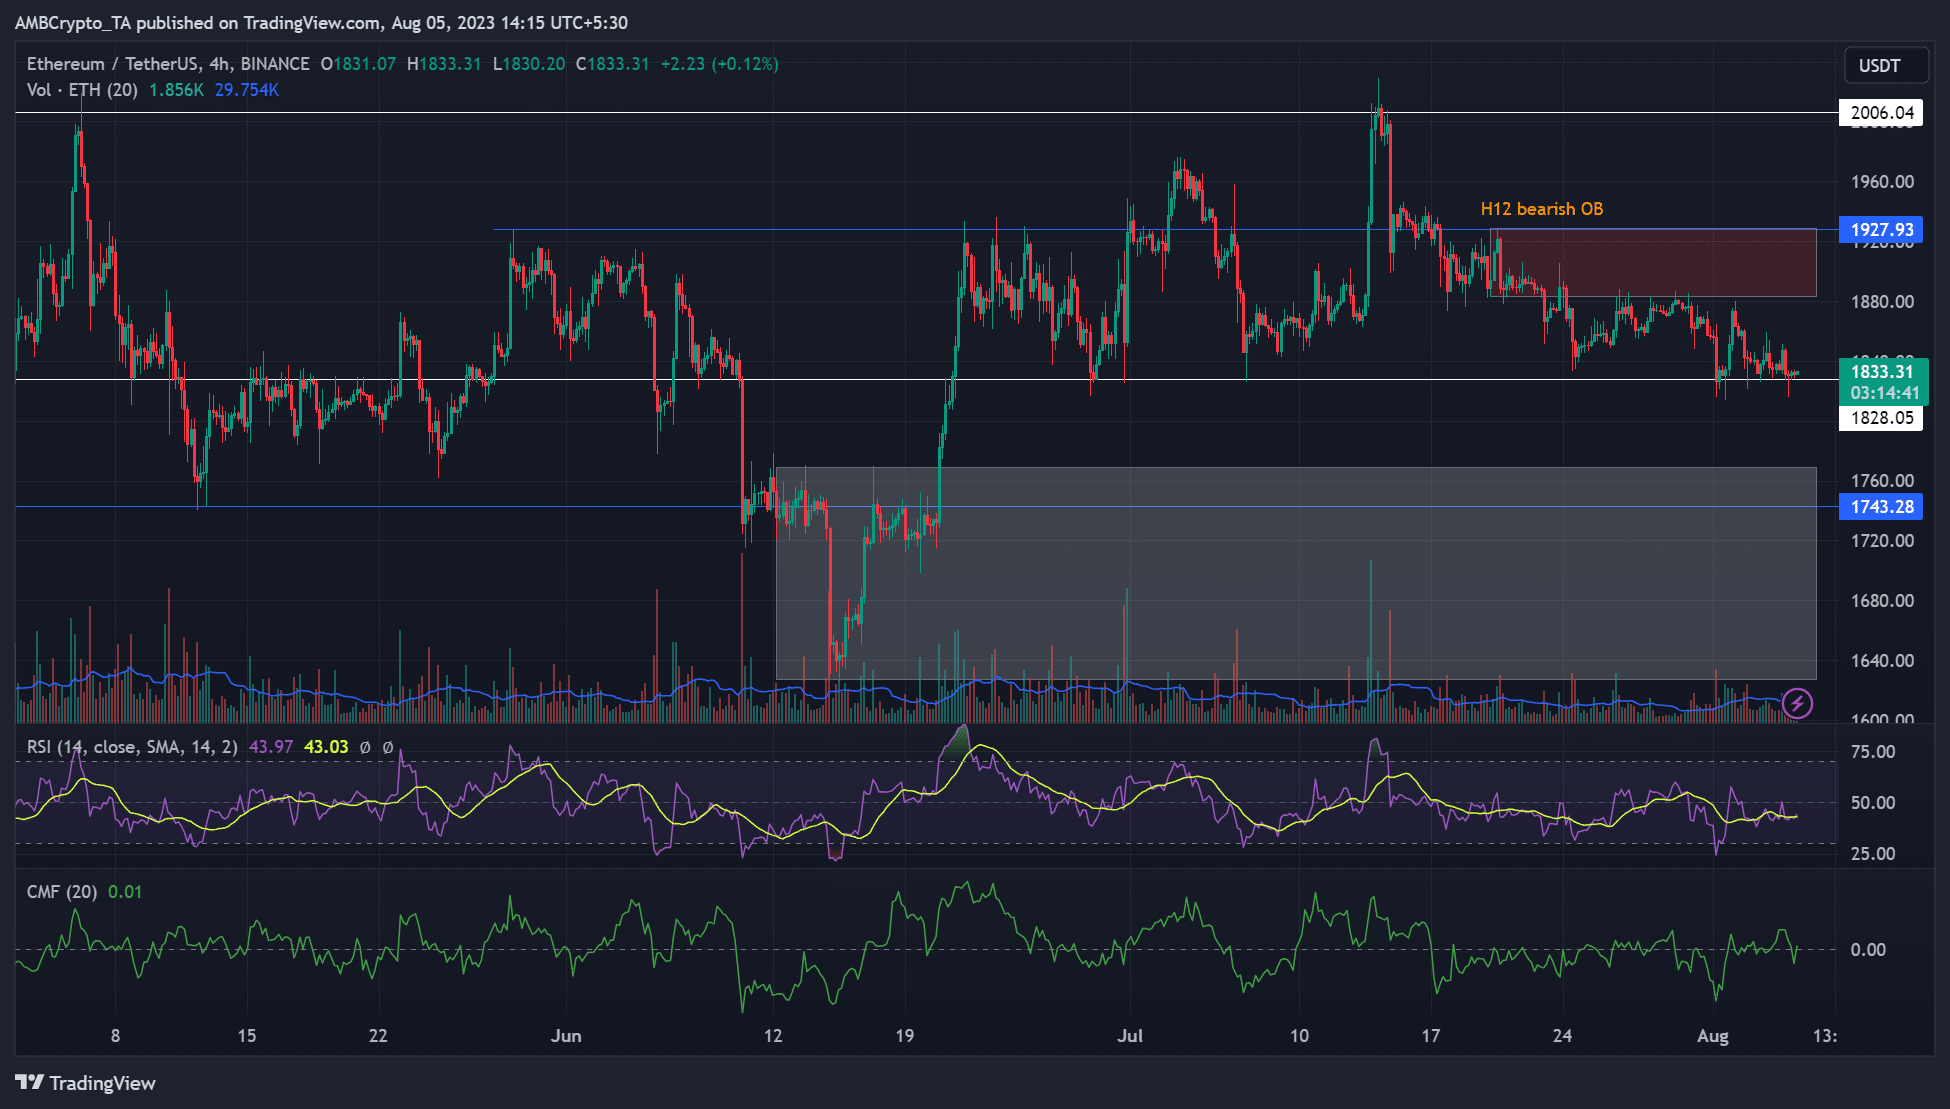
In the last few days, ETH’s price action has remained subdued below the roadblock and H12 bearish order block of $1883 – $1929 (red). With a weak BTC, roadblocks could persist, giving sellers more edge.
Below the range-low and immediate support of $1828 lies an old breaker ($1746) and a recent bullish order block (white) on the weekly chart.
If ETH breaches the range-low and consolidates below it, a retest of the $1700 zone is likely. So far, ETH has recorded positive price reactions whenever it retested the weekly breaker of $1743.
Hence, a retest and sweep of the weekly order block, especially around $1720- $1760, could see a move up toward $1880- $1927.
Conversely, bulls could defend the $1828 support. But they must clear the H12 order block to shift the market structure and reinforce bullish intent.
The Relative Strength Index was below the neutral level, denoting weak buying pressure. But capital inflows improved slightly, as demonstrated by Chaikin Money Flow’s reclaim of the zero mark.
ETH’s mixed signals

According to CryptoMeter, ETH’s spot metrics showed a neutral sentiment at the time of writing. Notably, there was little difference between buy and sell volume, with the latter dominating at 50.6% in the 24-hour timeframe.
According to Coinglass, volume dipped by about 1.9%, but Open Interest improved slightly by 1.5%. It suggests that ETH saw slight demand in the futures market at the time of writing.
How much are 1,10,100 ETHs worth today?
Interestingly, the futures market’s long-term bias was bearish, as shown by more liquidation of long positions on 24 and 12-hour timeframes. But the 1-hour- and 4-hour timeframes showed more short positions wrecked, reinforcing mild buying pressure and short-term bullish bias.
The above-mixed signals call for caution and clarity from BTC price action. A clearer market direction could be printed from 7 August.


