Ethereum bulls remain euphoric but bears will look to erase all the recent gains

Disclaimer: The information presented does not constitute financial, investment, trading, or other types of advice and is solely the writer’s opinion.
- The market structure flipped bullish for Ethereum last week
- The move above $1235 saw the range highs tested, but expecting a breakout could be dangerous
Ethereum has noted gains of 15.5% in the past three weeks. The defense of the $1160-$1180 region before Christmas was followed by a slow but steady ascent for the altcoin giant. At the time of writing, both Ethereum and Bitcoin traded close to significant resistance levels.
Read Ethereum’s Price Prediction 2023-24
Ethereum bulls face stern opposition at $1360, and Bitcoin also had a mountain to climb at $17.6k. A successful conquest could mean the rest of January could be bullish as well.
Ethereum reaches a month-long range high and a breakout was not yet in sight
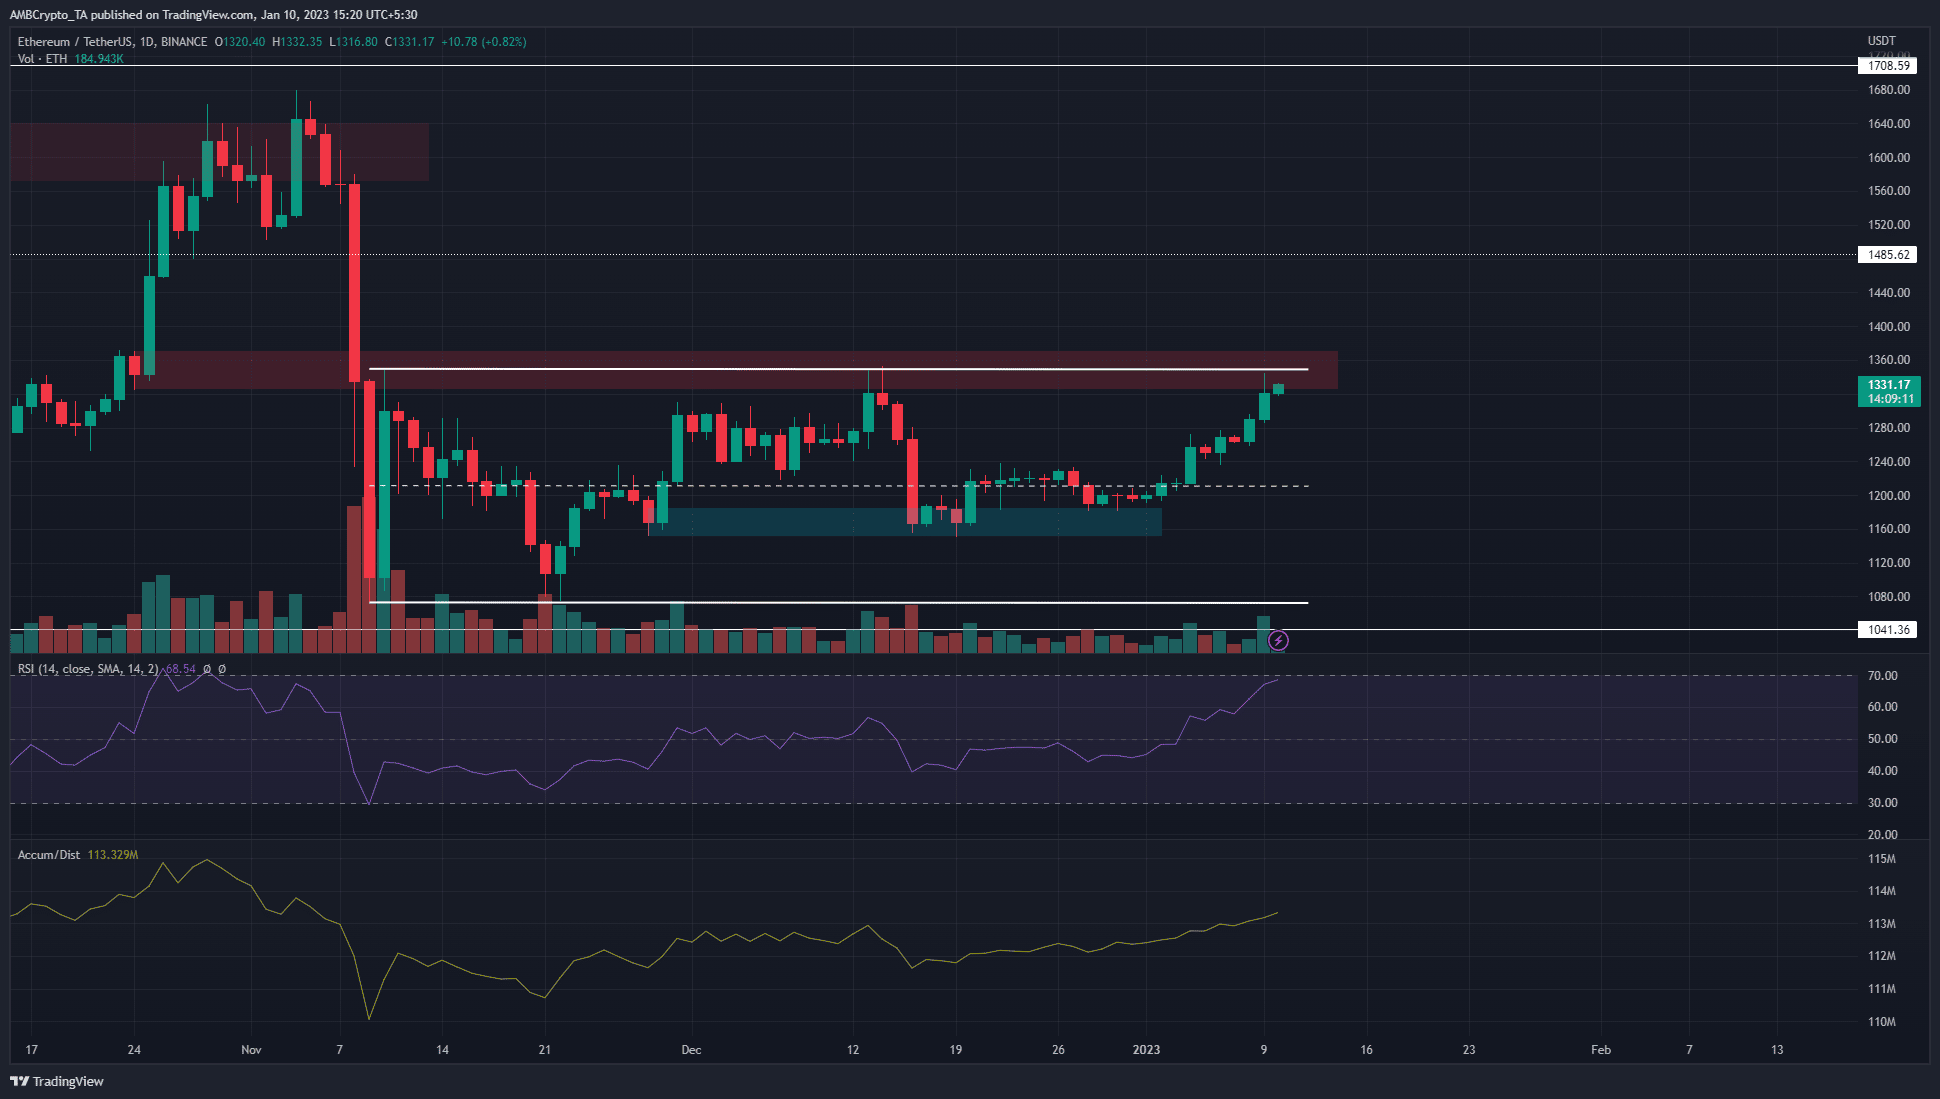
Since November, Ethereum has traded within a range from $1350 and $1072. At press time, the price was making gains toward the range high. Not only has it served as resistance over the past month but it was also the area where a bearish breaker from late October lies. This breaker, if breached and retested, would be a strong sign of bullish intent from the buyers.
Are your holdings flashing green? Check the ETH Profit Calculator
Yet, until that scenario materializes, traders can look to trade within the range itself. More often than not, a higher timeframe range is respected. Breakout traders can wait for a true breakout. The RSI was at 68 to show heavy bullish momentum. The upward-sloping A/D line also concurred that genuine demand fueled the ETH rally.
A daily session close above $1370 would be the first sign that rather than a reversal, traders can expect a move higher to $1485.
MVRV ratio showed holders at a profit while the funding rate remained positive
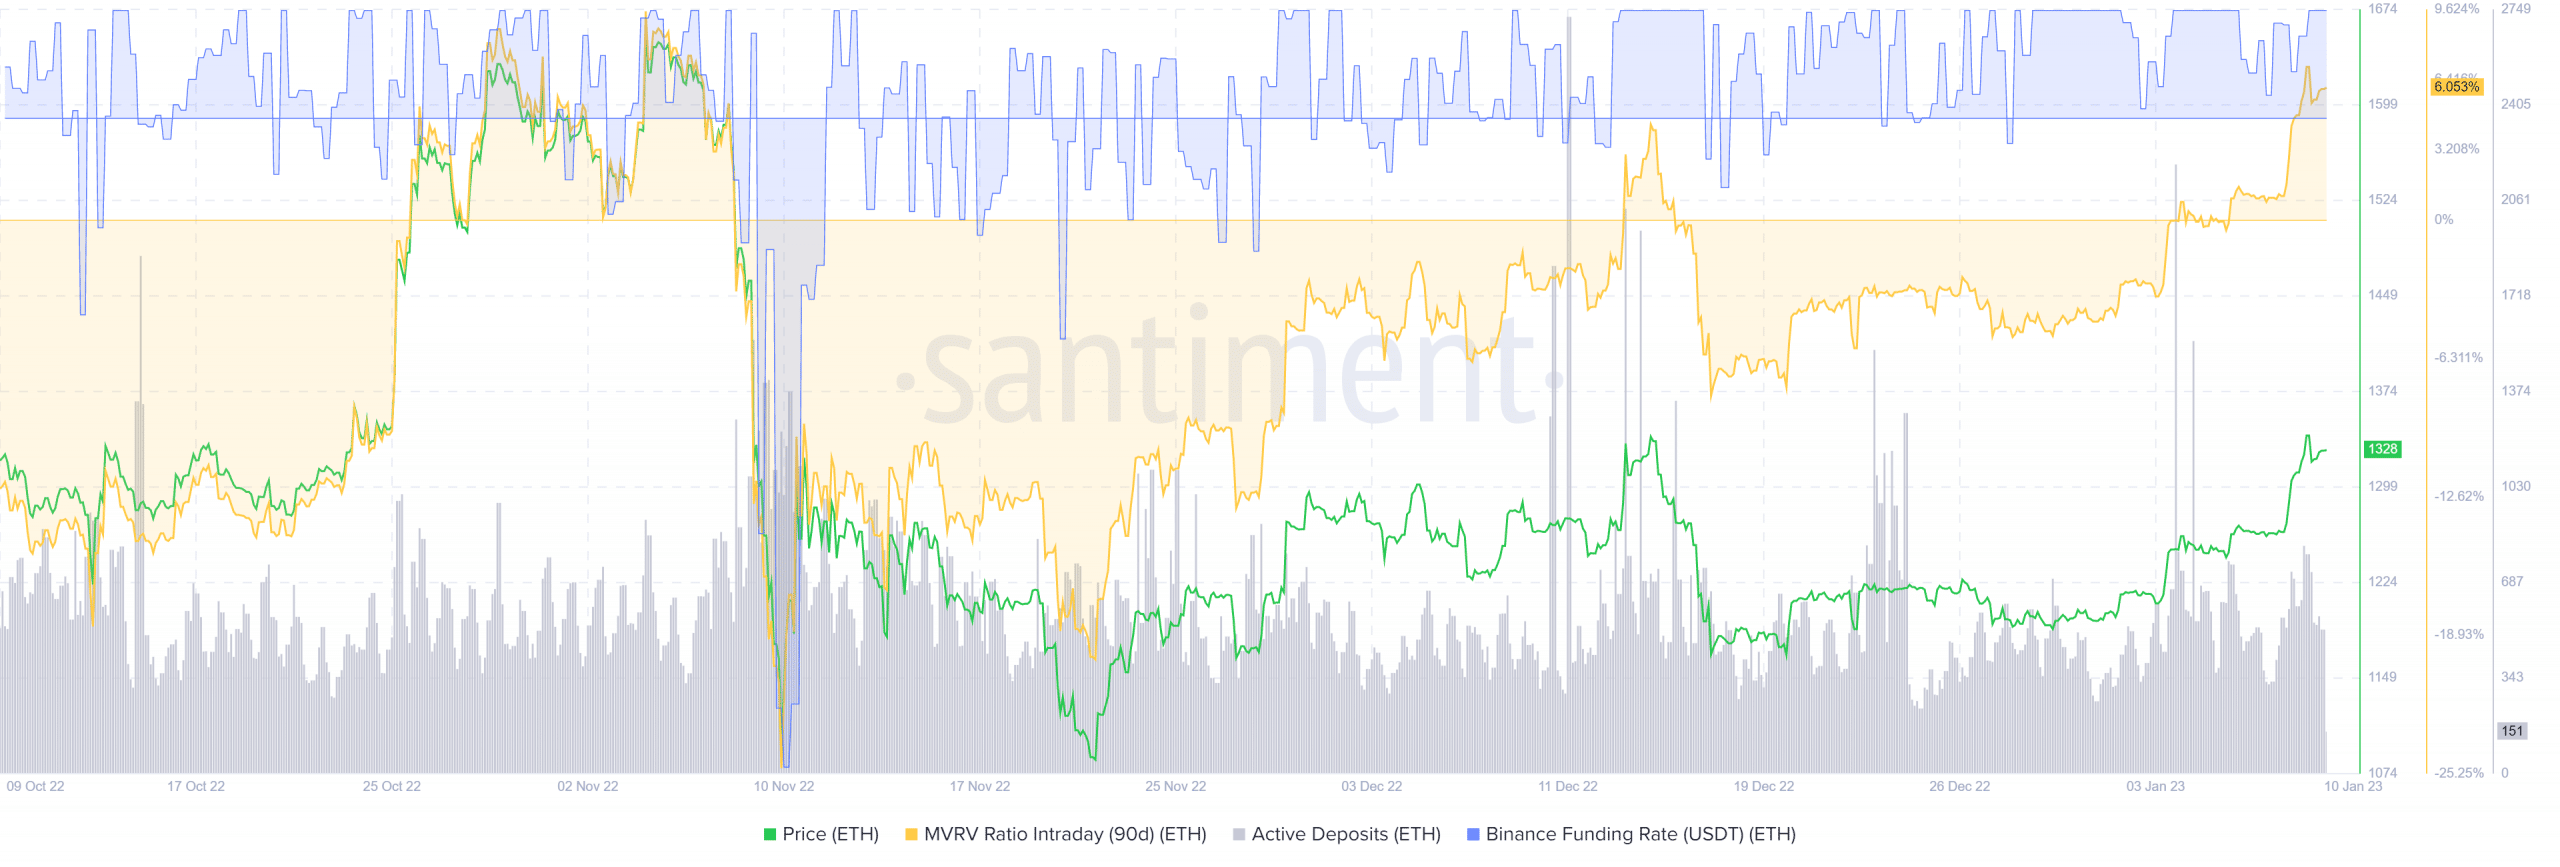
The positive funding rate meant long positions paid the short positions and overall signaled bullish sentiment. The active deposits metric saw some higher highs in the past ten days, but the spikes it saw last week were not followed by a large wave of selling.
Now that ETH was at a high timeframe area of interest, a spike in this metric could give bears some hope. The MVRV ratio (90-day) climbed to levels it had previously reached in late October. Could this be followed by a large wave of selling?