Ethereum can reject its bearish thesis only if…

Disclaimer: The findings of the following analysis are the sole opinions of the writer and should not be taken as investment advice
Ethereum’s abrupt pause just below $3,500 has raised some questions about its mid-long term trajectory. In fact, the latter looked quite subdued, at the time of writing. What’s more, the onus seemed to fall on a crucial zone. A zone that might confirm or deny a bearish thesis for the world’s largest altcoin.
At the time of writing, ETH was being traded at $2,938, down by 1.4% over the last 24 hours.
Ethereum Daily Chart
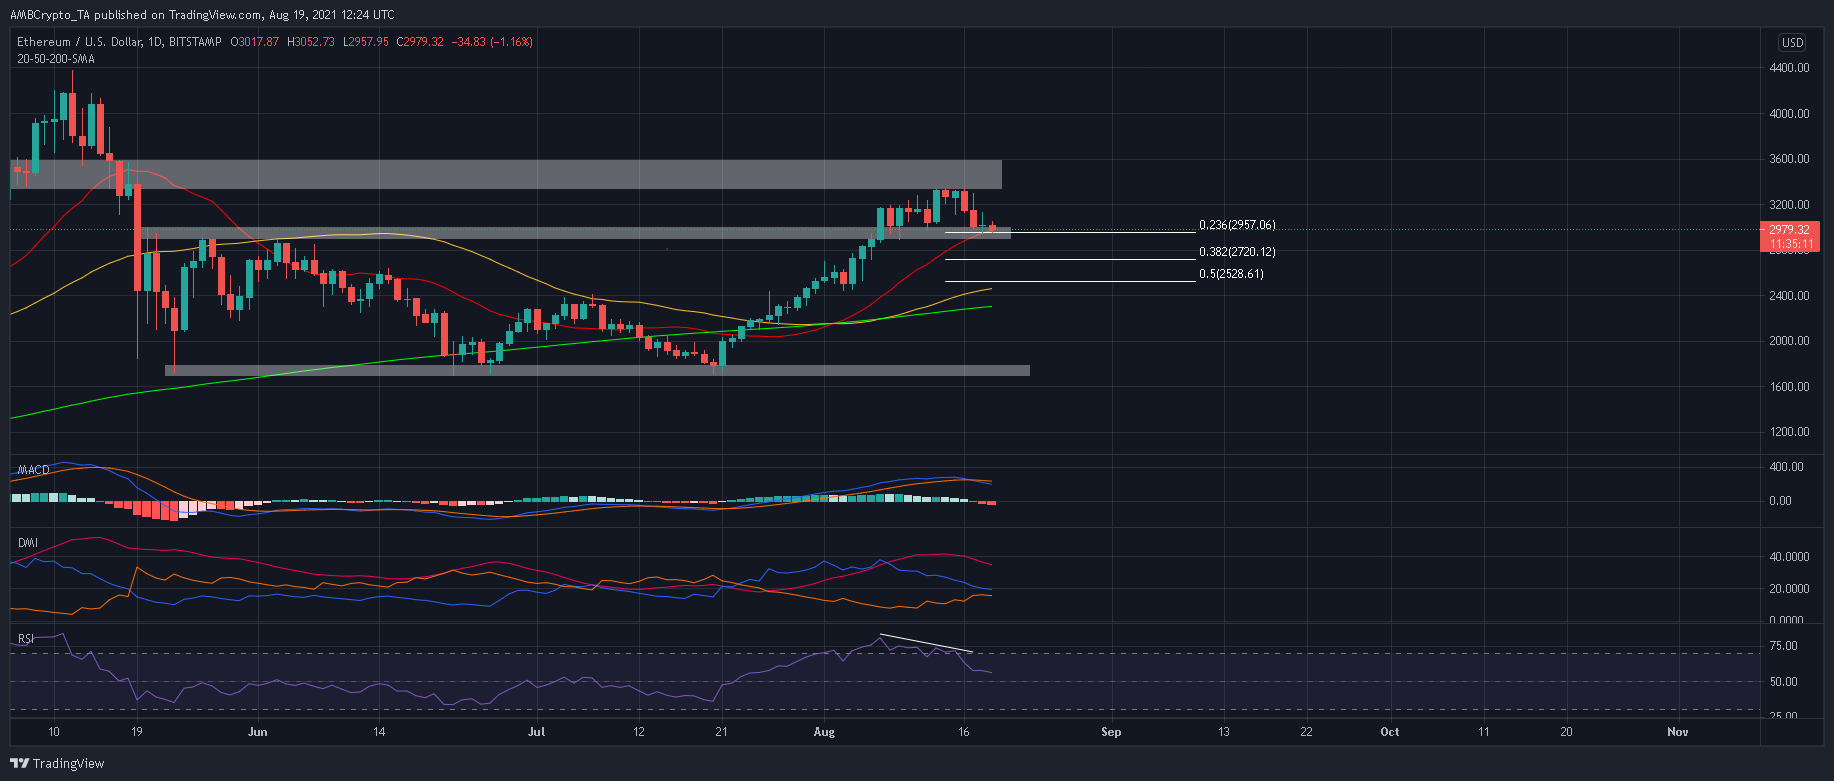
ETH lined up consecutive red candles on 16 and 17 August for the first time in nearly a month as buyers failed to sustain their efforts above $3,200. A doji candle, which followed soon after, failed to trigger an immediate reversal and ETH opened yet another day in the red. Spotlight now falls on the 20-SMA (red), the 23.6% Fibonacci level ($2,957), and a defensive line of $2,890.
If ETH closes below these points over the next 24 hours, chances of another 8% decline towards $2,700 will be high. Moreover, a fall below the 50% Fibonacci level ($2,528) would completely negate ETH’s bullish structure. Such a drastic outcome would be unlikely in the coming days, however.
Over here, it’s important to mention that BTC also threatened to drop below its daily 20-SMA. This is something that could have a proportional effect on ETH’s price as well.
To invalidate another sell-off, bulls would need to react quickly. A close above $3,000 would be a step in the right direction and a high formed at $3,200 would be the best-case outcome.
Reasoning
The MACD witnessed a bearish crossover for the first time in over a month and headed towards the half-line due to the recent selling pressure. The Directional Movement Index also suggested that ETH’s uptrend was in danger of halting its uptrend in case the -DI crosses above the +DI.
On the plus side, the RSI was still trading in bullish-neutral territory. During an uptrend, the RSI usually finds support between 40-50 and the same can be expected going forward. If this index does dip below 40, traders must brace for another sell-off.
Conclusion
There were multiple red flags in the Ethereum market and chances for a retracement towards $2,700 seemed high. However, the bulls did have a small window to prevent such an outcome.
Avoiding a close below the 38.2% Fibonacci level and forming a new high at $3,200 would reject a bearish thesis and allow ETH to make further progress on the charts.


