Ethereum, Cardano, Polkadot Price Analysis: 24 June

With Bitcoin’s price highlighting increased volatility and steep ups and downs, the most prominent alt – Ethereum – was quick to follow its lead. At press time, even though BTC’s price showed slight gains, ETH’s price was continuing on its downward trend.
On the contrary, while Cardano [ADA] noted a 14.80% dip over the last week, signs of recovery were evident on the back of its 24-hour price hike of 2.28%. Finally, DOT, after making a swift recovery from the 21 June drop, showed signs of weakening as its price fell by 5.8% in 24 hours.
Ethereum [ETH]
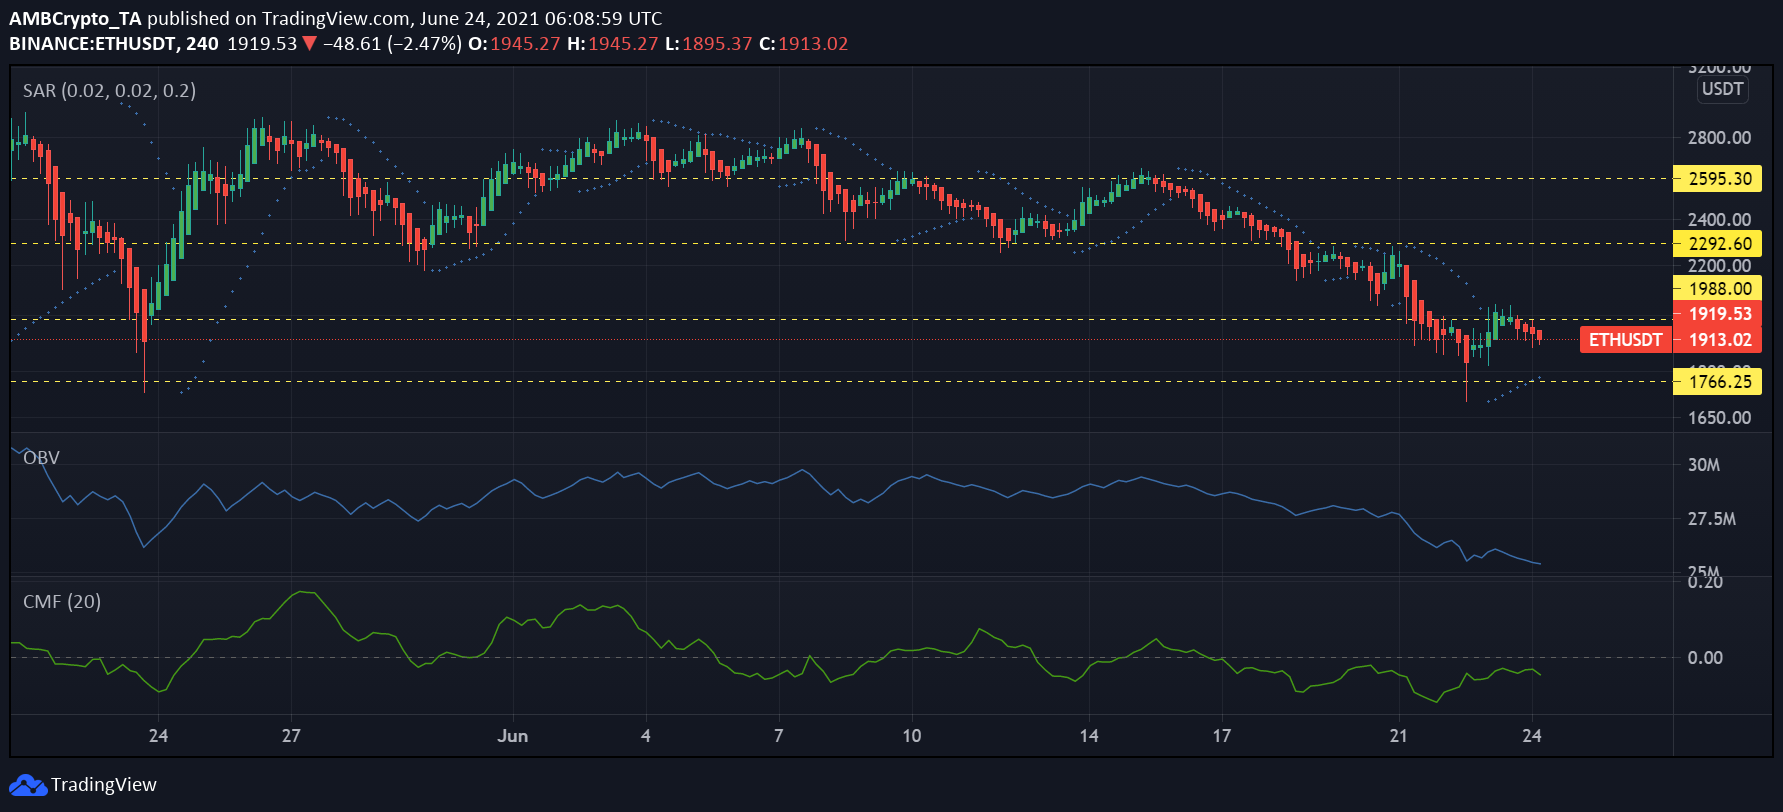
The king altcoin fell by 13% in just two days. However, a previous analysis had highlighted a decent recovery on the charts after ETH gained by almost 8.6% after 21 June. At press time, Ethereum’s price showed signs of weakening as the asset after testing the $1,988-resistance on 23 June bounced back down. Its key support level was at $1,766.25.
The Parabolic SAR’s dotted markers appeared below the candlesticks, highlighting a bearish trend for the alt. Capital outflows for the asset were dominant according to Chaikin Money Flow, with the indicator registering a downtick at press time.
The On Balance Volume saw persistent selling in the market as the blue line indicator continued its southbound trend. In fact, the indicator also seemed to surpass its May-end low, at the time of writing.
Cardano [ADA]
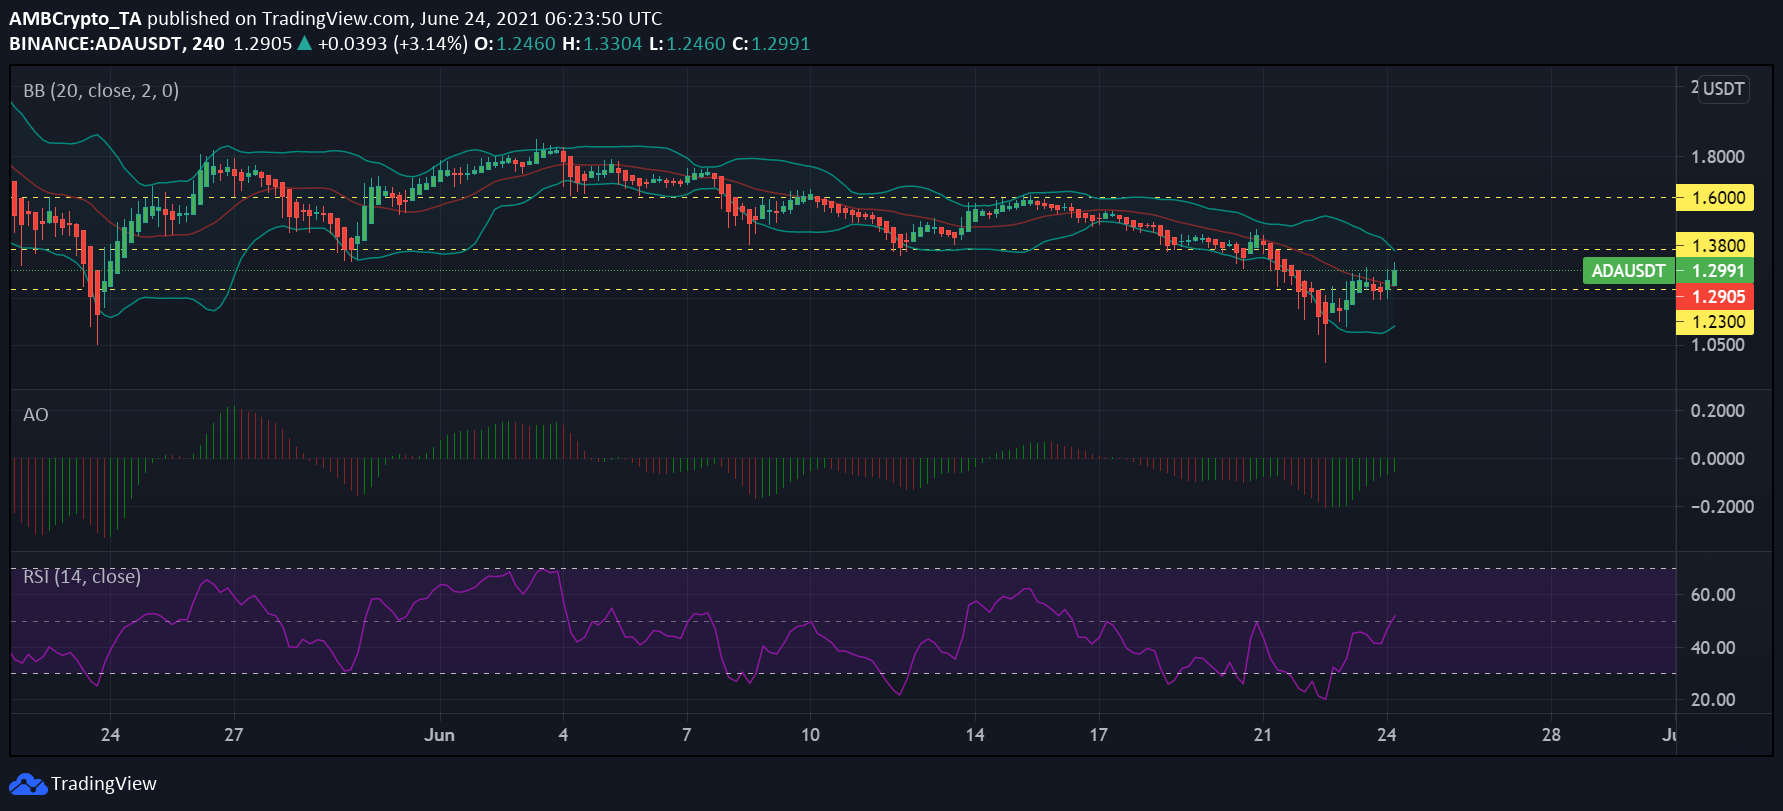
ADA was trading at $1.29, at press time, after recovering from its fall under the key support at $1.23. The press time resistance for the alt was at $1.38, a level that can be tested if ADA’s price gain continues. Cardano was down 46.50% from its ATH in May, 38 days ago, and had a breakeven multiple of 1.87.
The appearance of green candlesticks on the 4-hour chart for Cardano highlighted gains for the asset. This corresponded with the strengthening bullish momentum which could be observed building on the Awesome Oscillator with the appearance of green bars.
Further, the Bollinger Bands for the asset highlighted reduced market volatility and depicted a less expanded price range as the asset made a swift recovery from its lower lows. The Relative Strength Index (RSI) for ADA was in the neutral zone and had a reading of 52.05 at press time. While the RSI’s uptick highlighted a hike in buying pressure, buyers and sellers were almost equally dominant.
Polkadot [DOT]
Polkadot, after testing its support at $15 on 22 June, bounced back and traced slight signs of recovery. However, that didn’t hold for long as the asset’s price began a downtrend and tested the support again. DOT, ranked ninth on CoinMarketCap, was priced at $15.3 at press time and had fallen by 34.8% in the last 7 days.
The altcoin, after 21 June, was down by 24% at press time. The MACD and Signal lines underwent a slightly bullish crossover on 23 June, followed by almost parallel movement. Additionally, the convergence of the Bollinger Bands projected reduced price volatility and a comparatively restricted price range for the alt.
Finally, the Squeeze Momentum Indicator pictured that bearish pressure was dominant. However, the appearance of squeeze release pointed to receding bearish pressure. This could mean that slight price gains may be in store for the asset if the release, coupled with the appearance of darker candlesticks, continues.


