
Today, the crypto-market exhibited mundane price action, with certain altcoins trading in the red, at press time. For instance, ETH’s market capitalization fell by 2.2% while LINK’s trading volume noted an 89% hike. Finally, LTC’s recovery was halted as the crypto hovered close to its older support level of $141.
Ethereum [ETH]
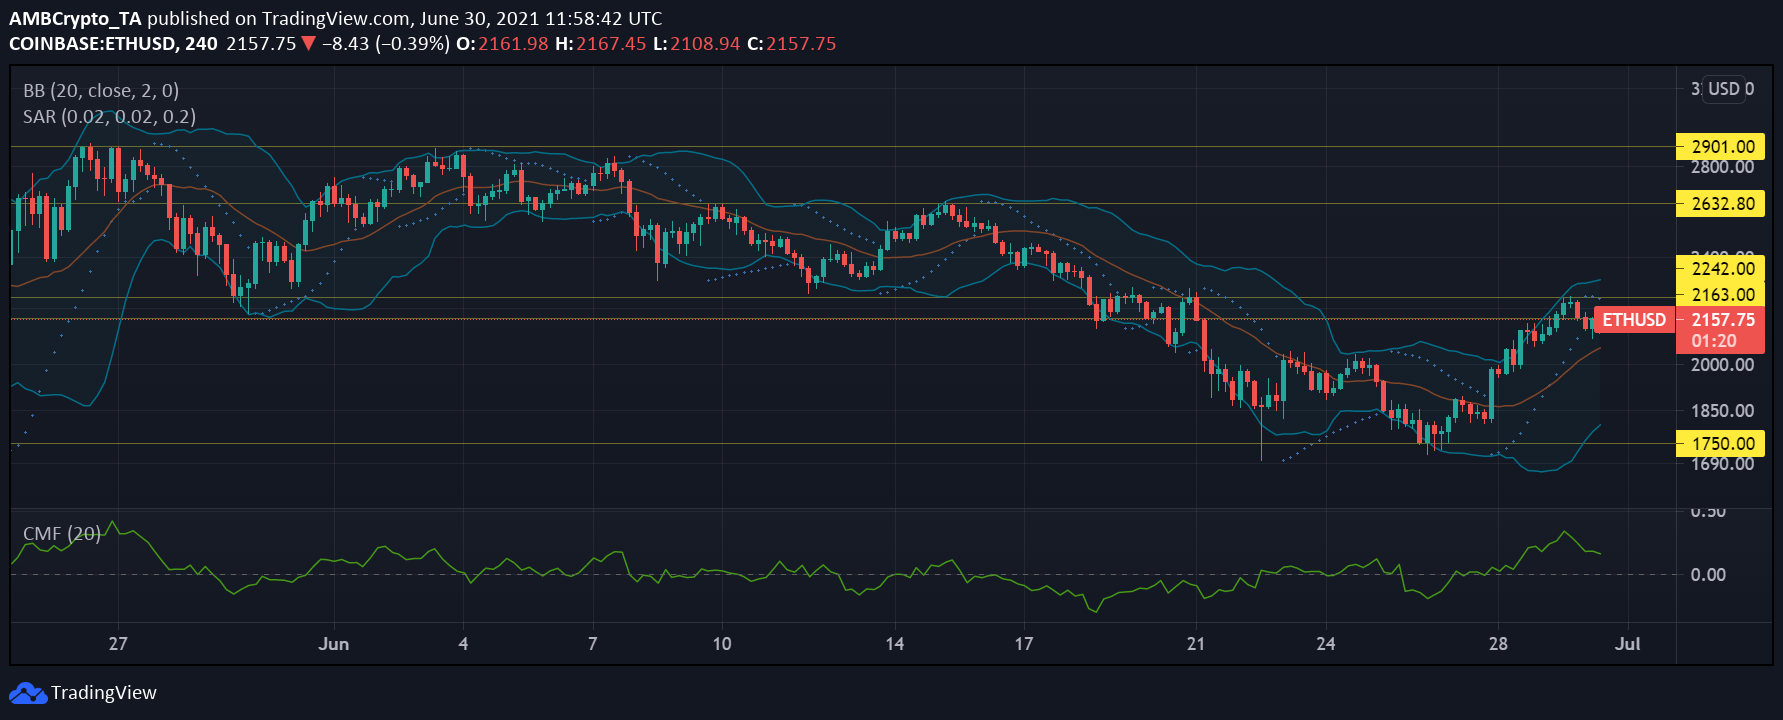
ETH/USD, TradingView
Ethereum was trading around the $2157 level again after it finally broke past it only 24 hours ago. Another dip over the next few trading sessions could push ETH further down the charts.
The Bollinger Bands were expanding at press time, a sign of growing volatility over the next few trading sessions. When Ethereum was rallying north, the Parabolic SAR corresponded with an uptrend. However, as the crypto’s price decreased, the onset of a downtrend was spotted too.
The Chaikin Money Flow pictured a decline in capital inflows as the alt’s price fell over the last 24 hours. At press time, capital inflows were still higher than capital outflows though.
Chainlink [LINK]
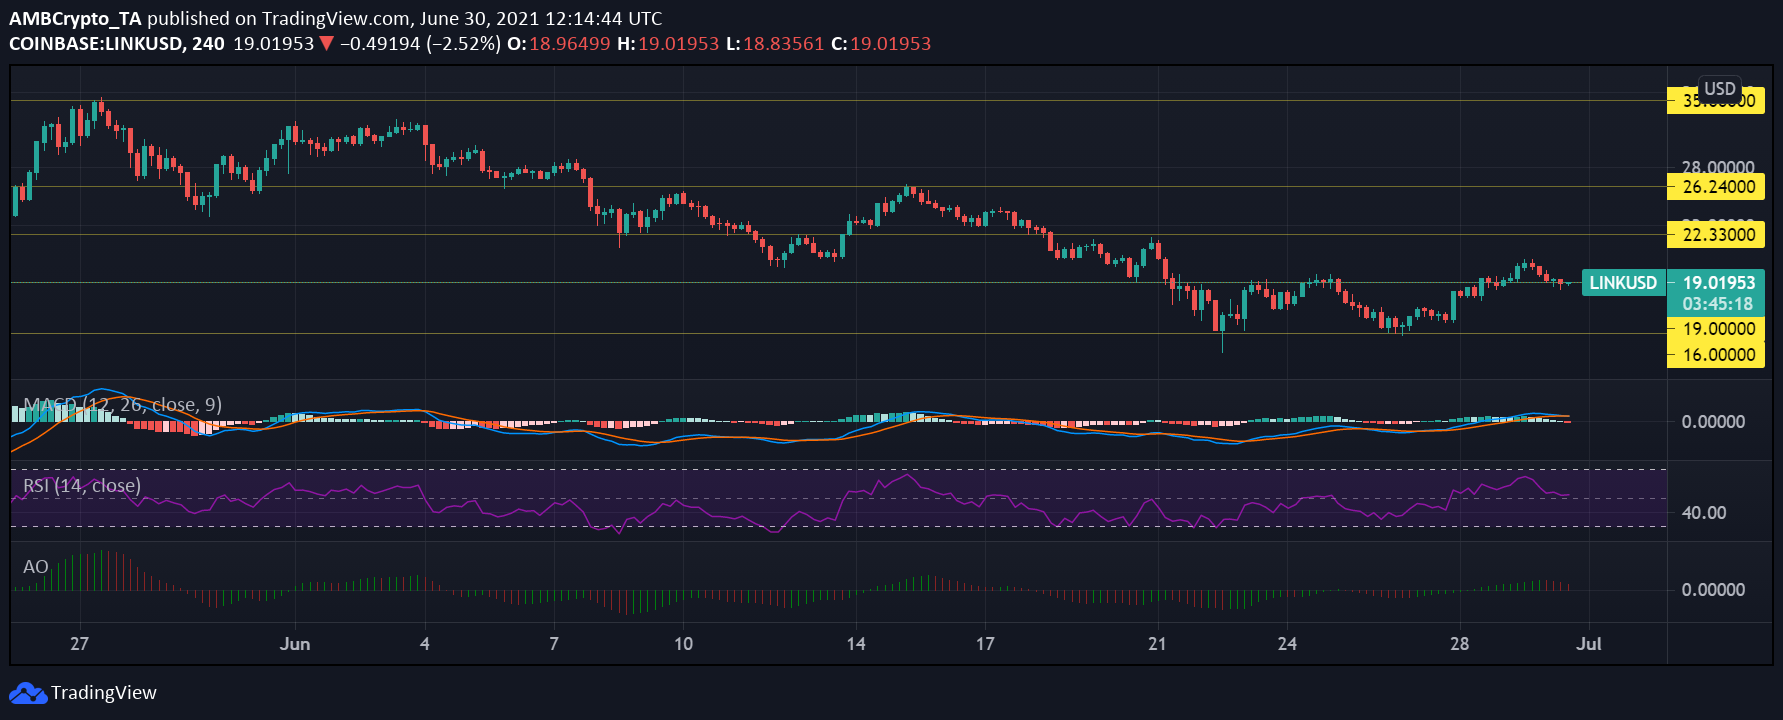
LINK/USD, TradingView
LINK’s recovery in price was not backed by a strong uptrend as it fell by 5.6% in 24 hours. The market was back to trade under bearish pressure after a sporadic uptrend that occurred over the last few days.
If LINK fails to consolidate and hold its position around the $19-level and if the downtrend continues, LINK may test the $16 support level once again.
The Relative Strength Index moved south as selling pressure rose. Even so, the same was at equilibrium, at press time. The MACD’s histogram was bullish for a couple of days before it recorded a bearish crossover on 30 June.
In accordance with the prevailing downtrend, the Awesome Oscillator too pictured a loss in momentum as the red signal lines became visible.
Litecoin [LTC]
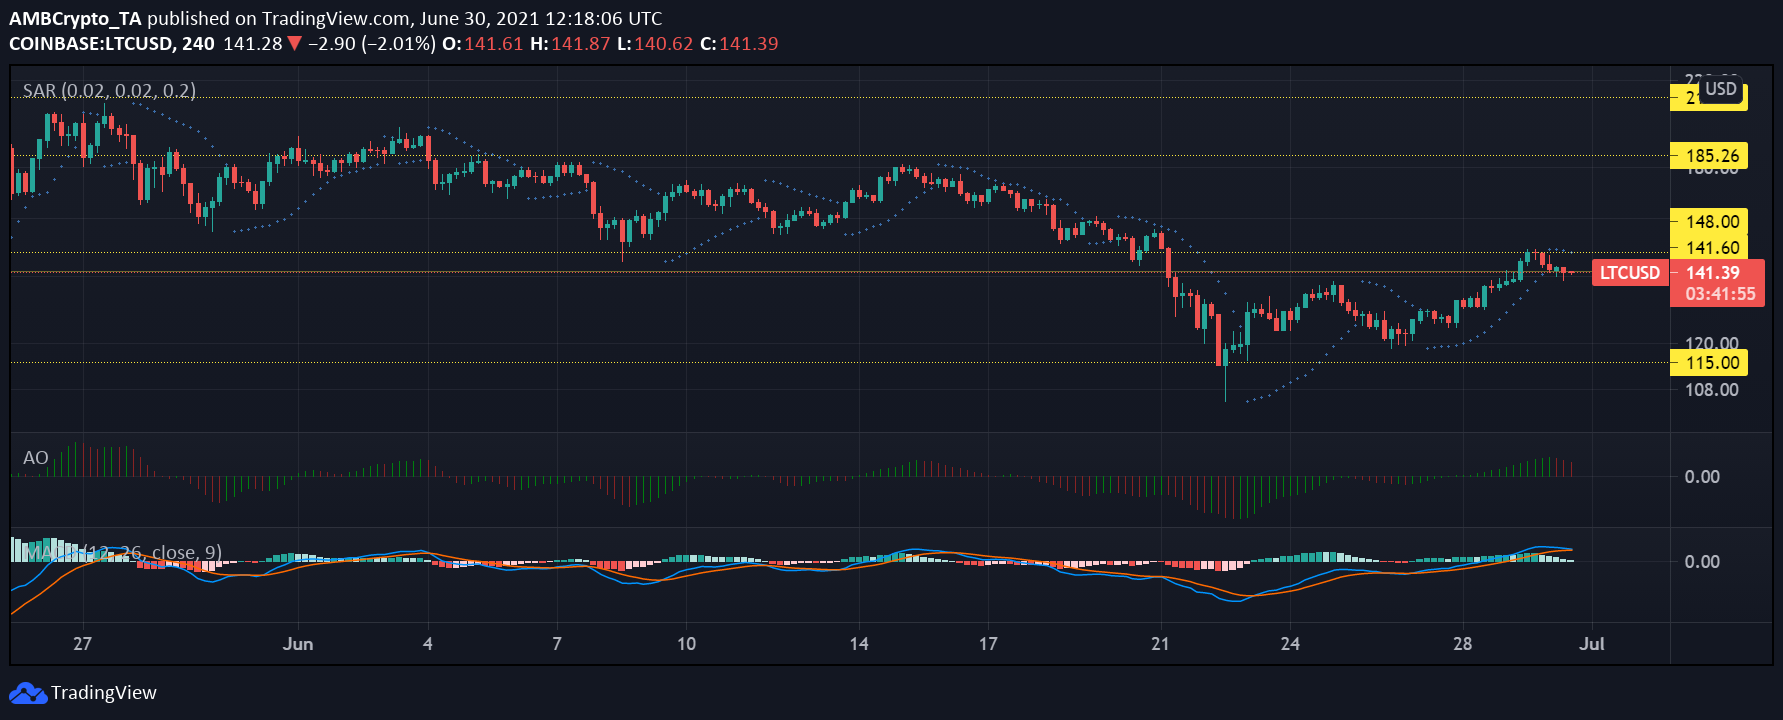
LTC/USD, TradingView
Litecoin’s price movements at press time were absolutely immediate, with the crypto oscillating within a restricted price band. LTC was trading in the red, just like other major altcoins. However, to suggest that the bears have taken over again would be an overstatement. If the coin manages to stay close to the $141-level, then the coin can picture breaking past it over the next few trading sessions.
The appearance of red bards on the Awesome Oscillator suggested that the alt’s price had taken a bearish turn over the last 24 hours. Interestingly, the MACD’s histogram still appeared green. Alas, a bearish crossover in the near term seemed very likely.
Finally, the Parabolic SAR pictured the onset of a downtrend as the alt’s price fell in the late hours of 29 June.