Ethereum, Chainlink, VeChain Price Analysis: 9 December

While the market refrained from high volatility over the last day, Ethereum and Chainlink technicals hinted at a slight bullish bias. Ethereum managed to breach the 61.8% hurdle while Chainlink struggled to cross the golden Fibonacci level after forming a reversal pattern.
On the other hand, VeChain continued its bearish movement.
Ethereum (ETH)
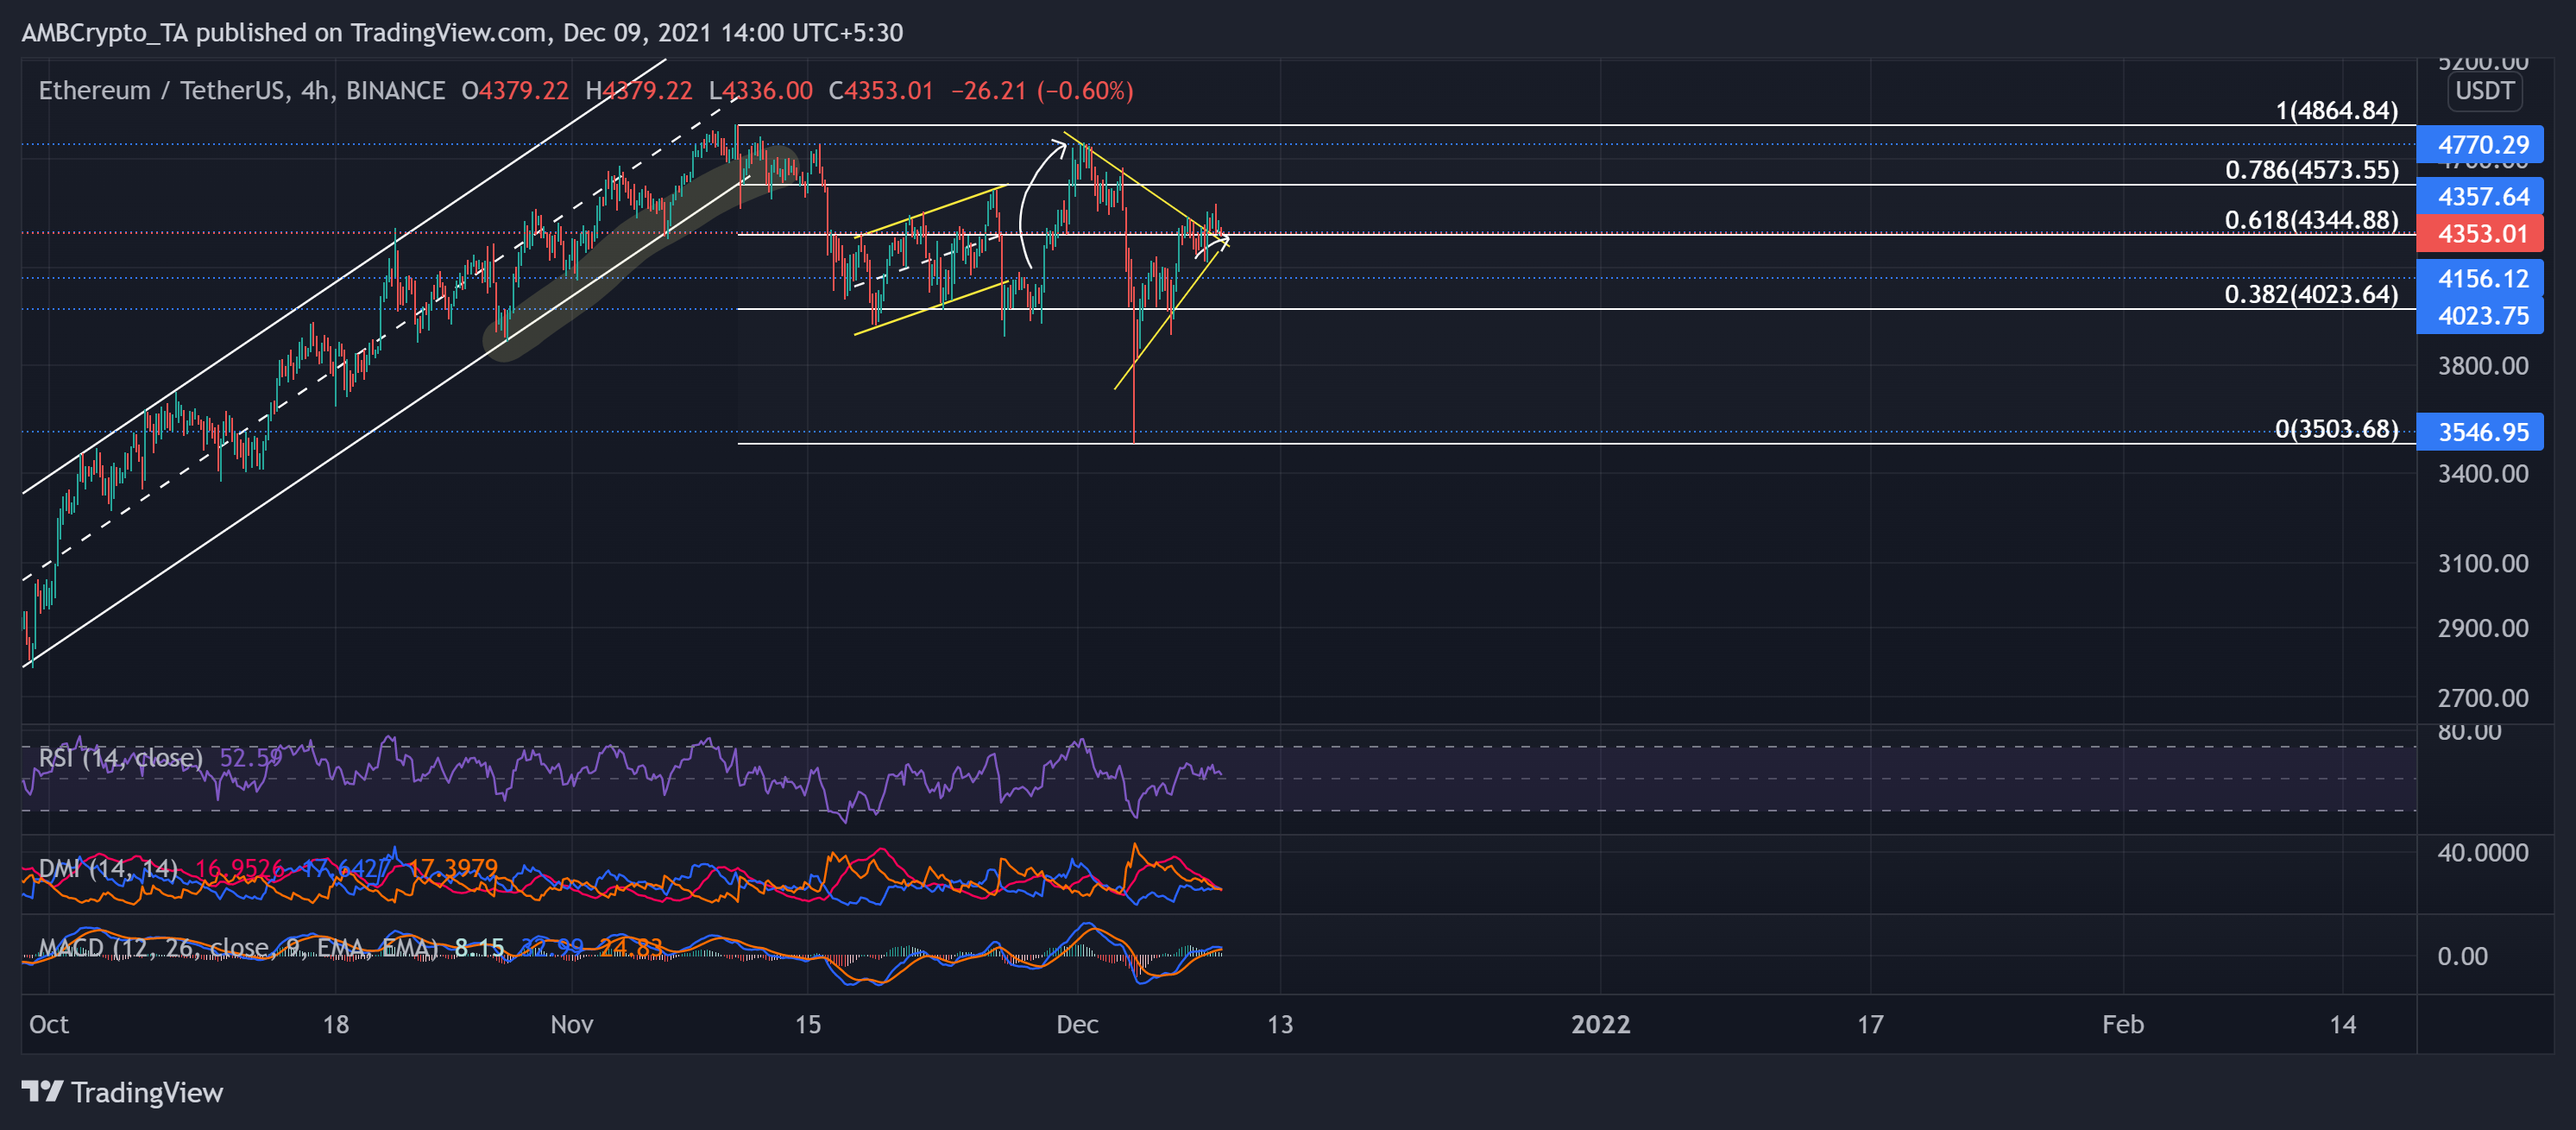
King alt registered a 23.9% ROI after poking its seven-week low on 3 December. As a result, it climbed above the 61.8% Fibonacci resistance post a symmetrical triangle breakout.
The bears halted the 52-day up-channel rally on 12 November as the alt saw a breakdown. But the bulls ensured the seven-week support at the $4,023-mark. After which, they triggered a brief upturn but could not breach the $4,770-resistance. Then, consequent to a massive sell-off, the alt witnessed a steep plummet.
Although ETH has had an impressive run over the past few days, it occurred on rather decreasing volumes, depicting a weak bullish motion.
At press time, the alt traded at $4353.01. The RSI was in an uptrend after displaying a bullish bias. Also, the MACD was above the zero-line and confirmed RSI’s conclusion. However, the DMI indicated a weak directional trend.
Chainlink (LINK)

Over the past five days, LINK formed a rising wedge (reversal) pattern on its 4-hour chart. As a result, it saw a downfall from the 61.8% Fibonacci resistance post a rising wedge breakout.
The digital currency continually downturned after hitting its six-month high on 10 November as bears ensured the 29-week resistance at the $34.9-mark. Although the bulls slackened, they ensured the four-month support at the $18.6-mark. Consequently, LINK traded at $21.86 after noting a nearly 18.97% two-day gain.
The RSI swayed above the midline, hinting at a slight bullish preference. Further, the bullish MACD lines projected the near-term bullish push. But the ADX was on a downfall after displaying a weak trend. Now, LINK bulls will need accelerated force to retest the 61.8% hurdle before crossing it.
VeChain (VET)
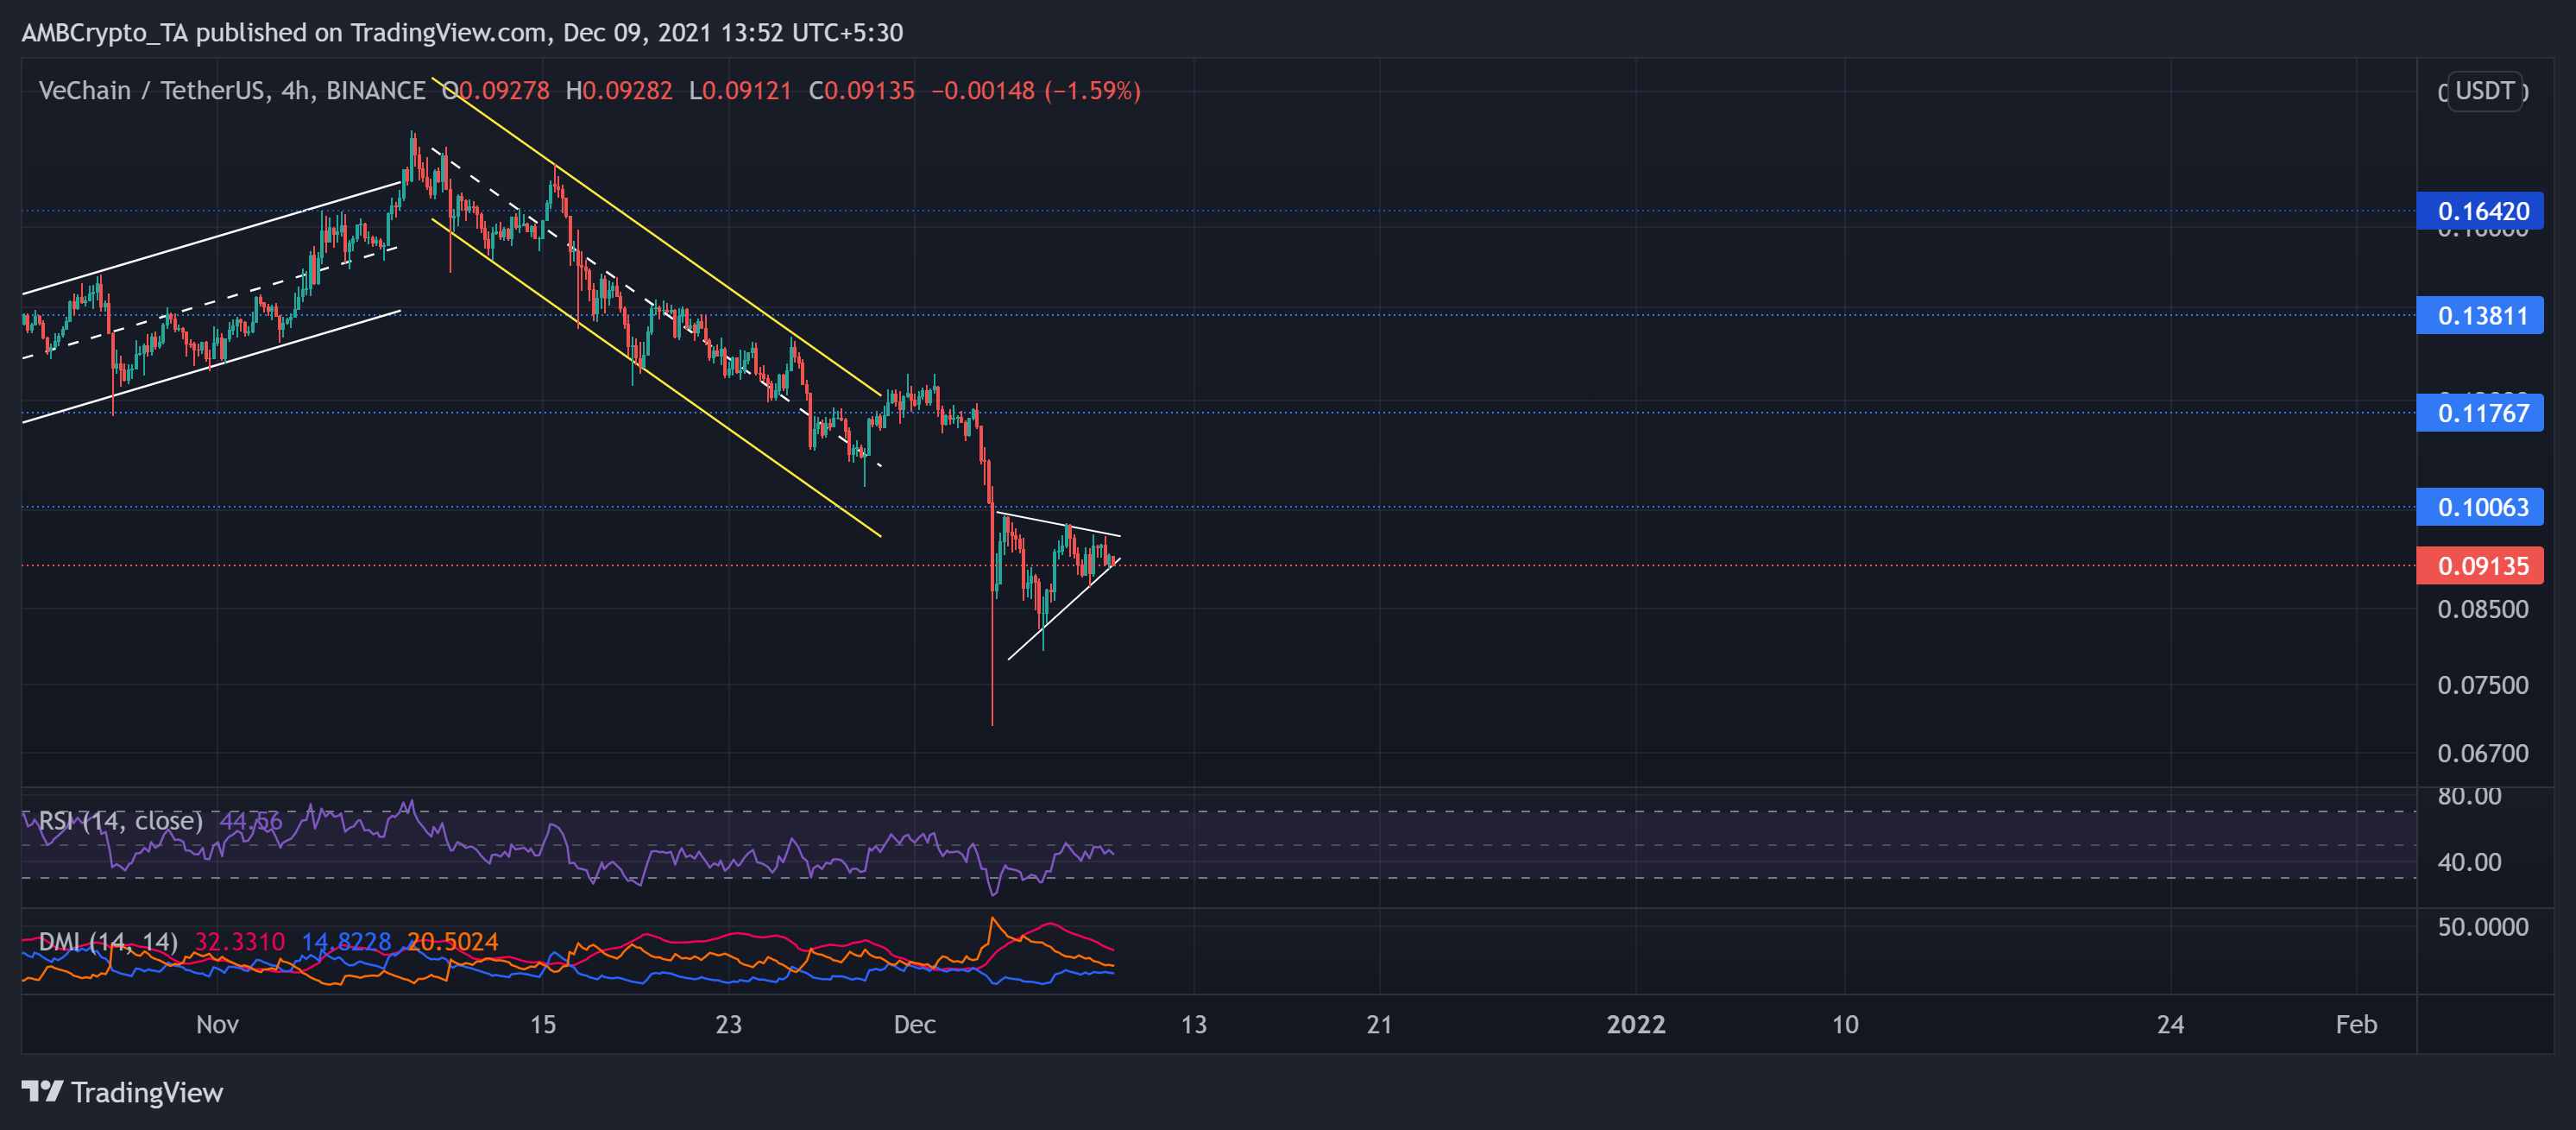
VET continued its bearish drift for the past month after it poked its six-month high on 9 November. As a result, the altcoin saw a staggering 46.7% 30-day decline. With this fall, it invalidated its long-term bullish trend.
The bears ensured the $0.117-mark seven-week resistance even after a down-channel breakout. Over the past five days, VET formed a symmetrical triangle on its 4-hour chart after flashing bearish tendencies. At press time, the alt traded at $0.09135.
On the 4-hour timeframe, VET’s RSI practically struggled to breach the midline since mid-November, depicting a substantially strong bearish influence. Moreover, it was southbound and showed no near-term revival signs. Further, the DMI lines visibly confirmed the bearish bias too.


