Ethereum Classic [ETC] flips bias to bullish, can traders look to buy a pullback?

Disclaimer: The findings of the following analysis are the sole opinions of the writer and should not be considered investment advice
- Ethereum Classic jumped above the short-term range highs at $24.3
- A gap in the charts, if filled, could present a buying opportunity
Ethereum Classic [ETC] has laboured underneath the yoke of the bears since mid-September when ETC fell beneath the $31.3-support level. The past few hours of trading saw the bulls break off their shackles, and a bullish move towards $29 seemed to be brewing.
Here’s AMBCrypto’s Price Prediction for Ethereum Classic [ETC] in 2022-23
Technical analysis revealed some incongruences between the price movement of ETC and the behavior of the asset in the Futures market. Speculators, although bullish in the short-term, might not be arriving in the market in droves to capitalize on Ethereum Classic’s change in fortunes.
Inefficiency combined with a bullish breaker could offer buying opportunities on a pullback
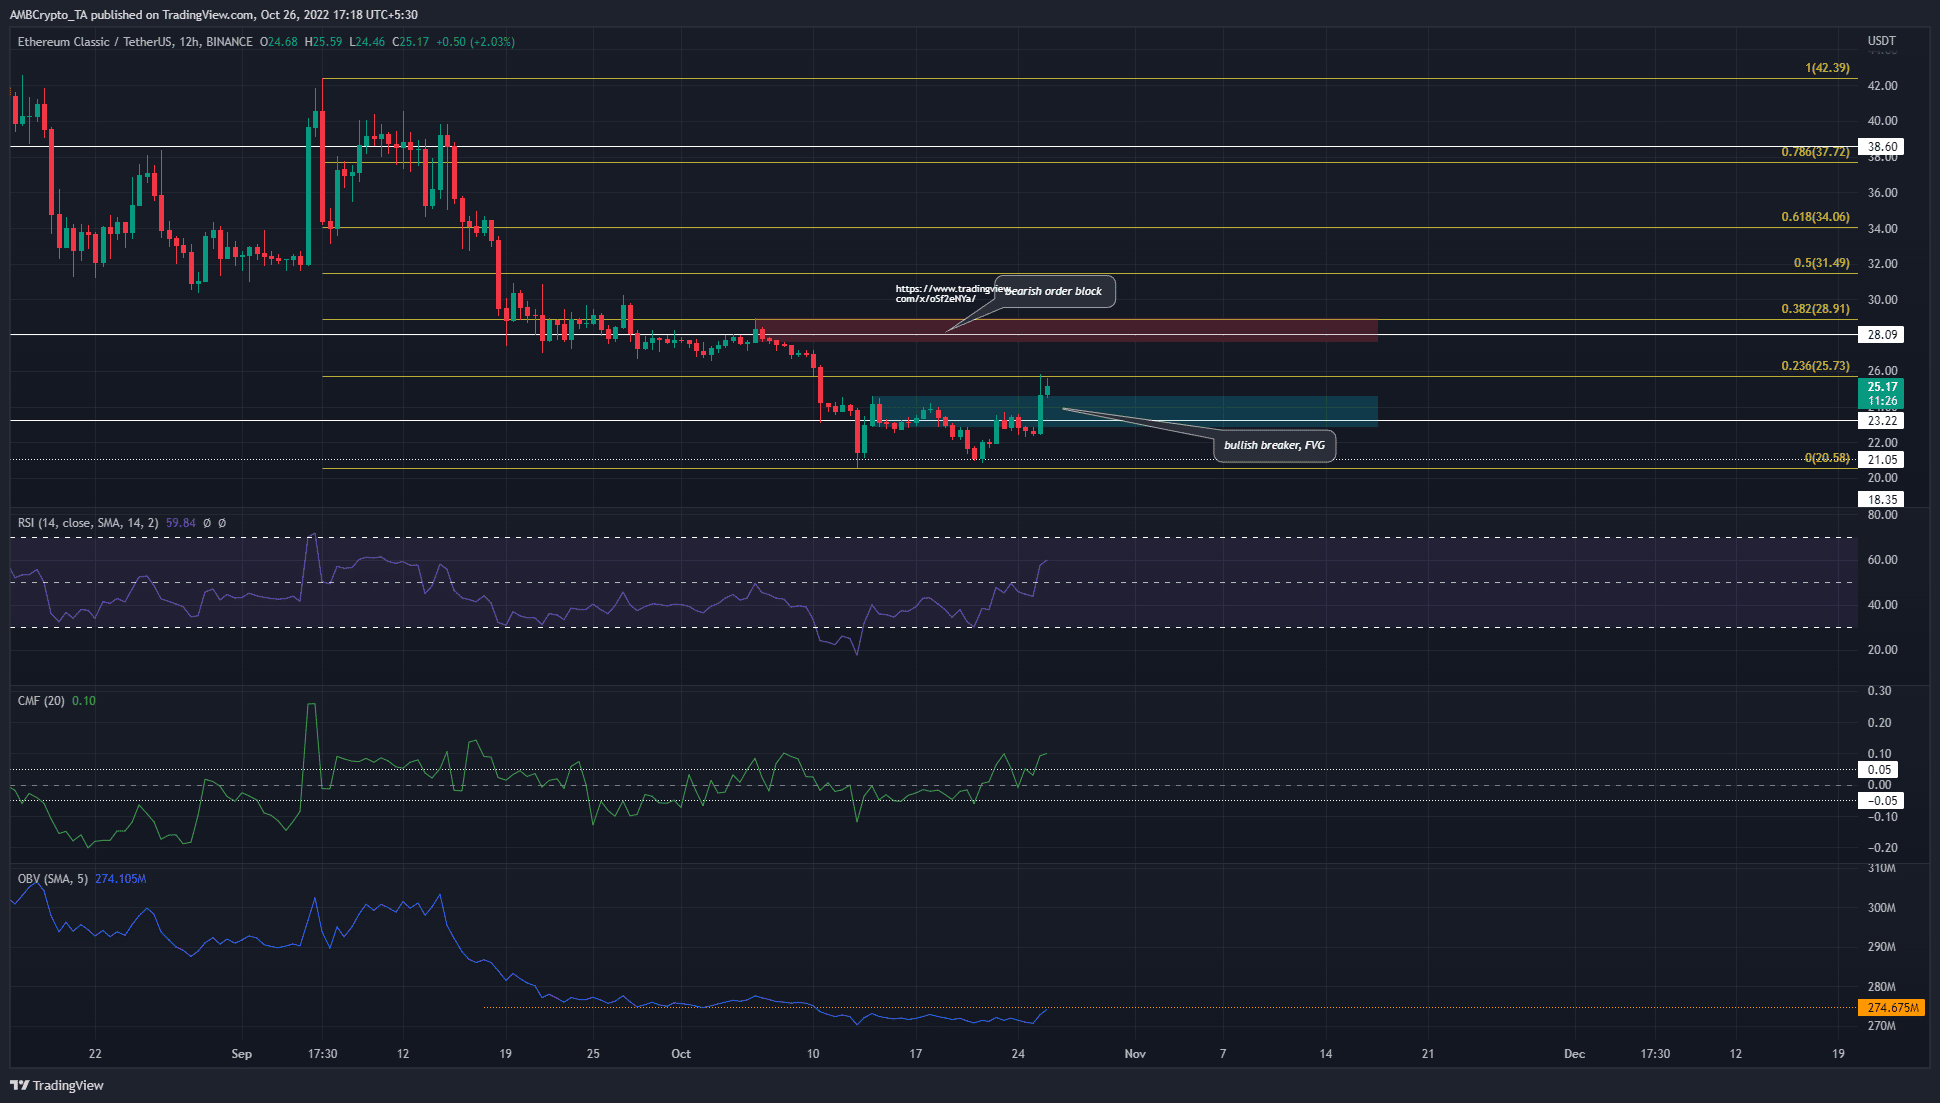
A set of Fibonacci retracement levels (yellow) was plotted based on ETC’s drop from $42.39 to $20.58. In white, some important horizontal levels were also plotted. In recent weeks, the trend behind Ethereum Classic has been strongly bearish. This was a fact reflected in both the RSI and the OBV. The RSI has been below neutral 50 since mid-September. The OBV was also on a steady decline over nearly two months.
And yet, the past few hours of trading saw a huge surge in prices. Bitcoin managed to climb past the $19.6k-resistance and Ethereum Classic followed in its wake. The 24 hours preceding the time of writing have seen ETC register gains of nearly 12%.
This move also broke the bearish market structure and flipped it to bullish on the 12-hour and daily timeframes. This was a significant development. The $23.2-zone had been a bearish order block previously, but it was turned into a bullish breaker. To the north, another bearish order block lay at $29.
The swift move north also left an inefficiency on the chart from $23.62 to $24.47. Therefore, there is a good chance that a retracement to these levels and into the bullish breaker could be seen soon.
Falling Open Interest suggests the recent rally might not be backed by genuine demand
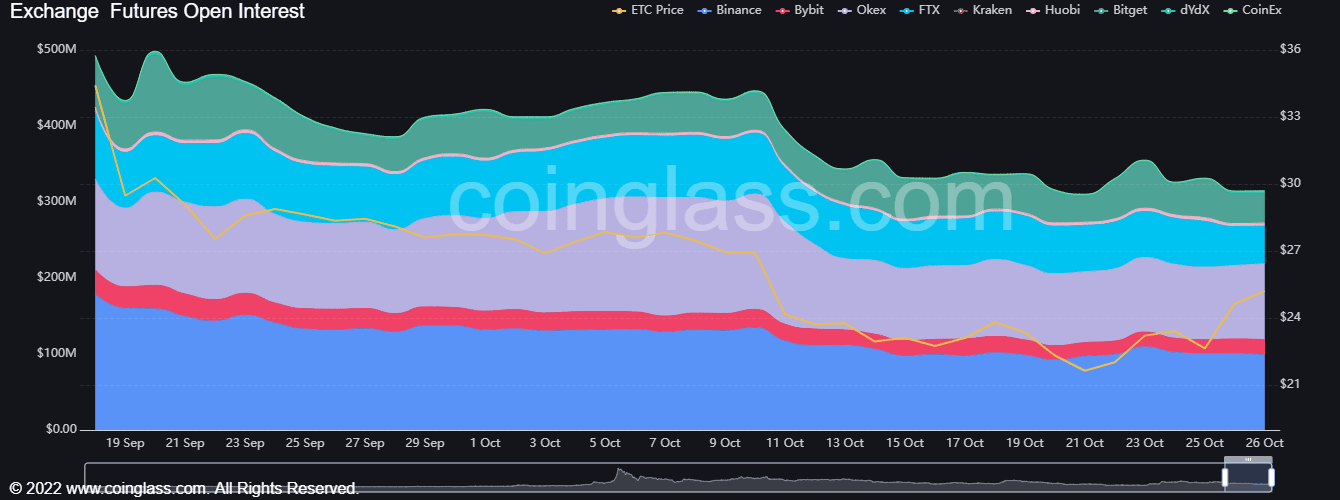
Although the price charts showed a bullish bias and suggested minor dips could be used to buy, the Open Interest chart did not agree. The past two weeks saw Ethereum Classic range between $$24.3 to $21.3. During this time, the Open Interest had been relatively flat. While the rally from the range lows on Friday was accompanied by an uptick in OI, the recent move past $24.5 was not.
Therefore, it could have been longer-term short positions being closed (short covering) rather than genuine demand behind ETC. Meanwhile, the Long/Short ratio was skewed in favor of Ethereum Classic bulls over the last 24 hours.
Buyers can look to buy a move into the aforementioned gap, but their expectations of a move straight to $29 should be tempered with caution.