Ethereum Classic [ETC] has bullish momentum but can it see further gains

Disclaimer: The findings of the following analysis are the sole opinions of the writer and should not be considered investment advice.
- Daily timeframe structure showed a bearish bias
- Lower timeframe charts bullish
- ETC halted at an important zone of resistance- what next?
Over the past two days, Ethereum Classic flipped its short-term momentum from bearish to bullish. ETC bounced quickly from the $21.1 support level and posted gains of nearly 10% in the past 36 hours alone.
Here’s AMBCrypto’s Price Prediction for Ethereum Classic [ETC] for 2022-2023
The higher timeframe bias remained bearish, and it was likely that Ethereum Classic could soon face selling pressure. This was because it was trading within a zone where longer-term bears would be looking to sell the rally.
Price action shows short-term buying pressure
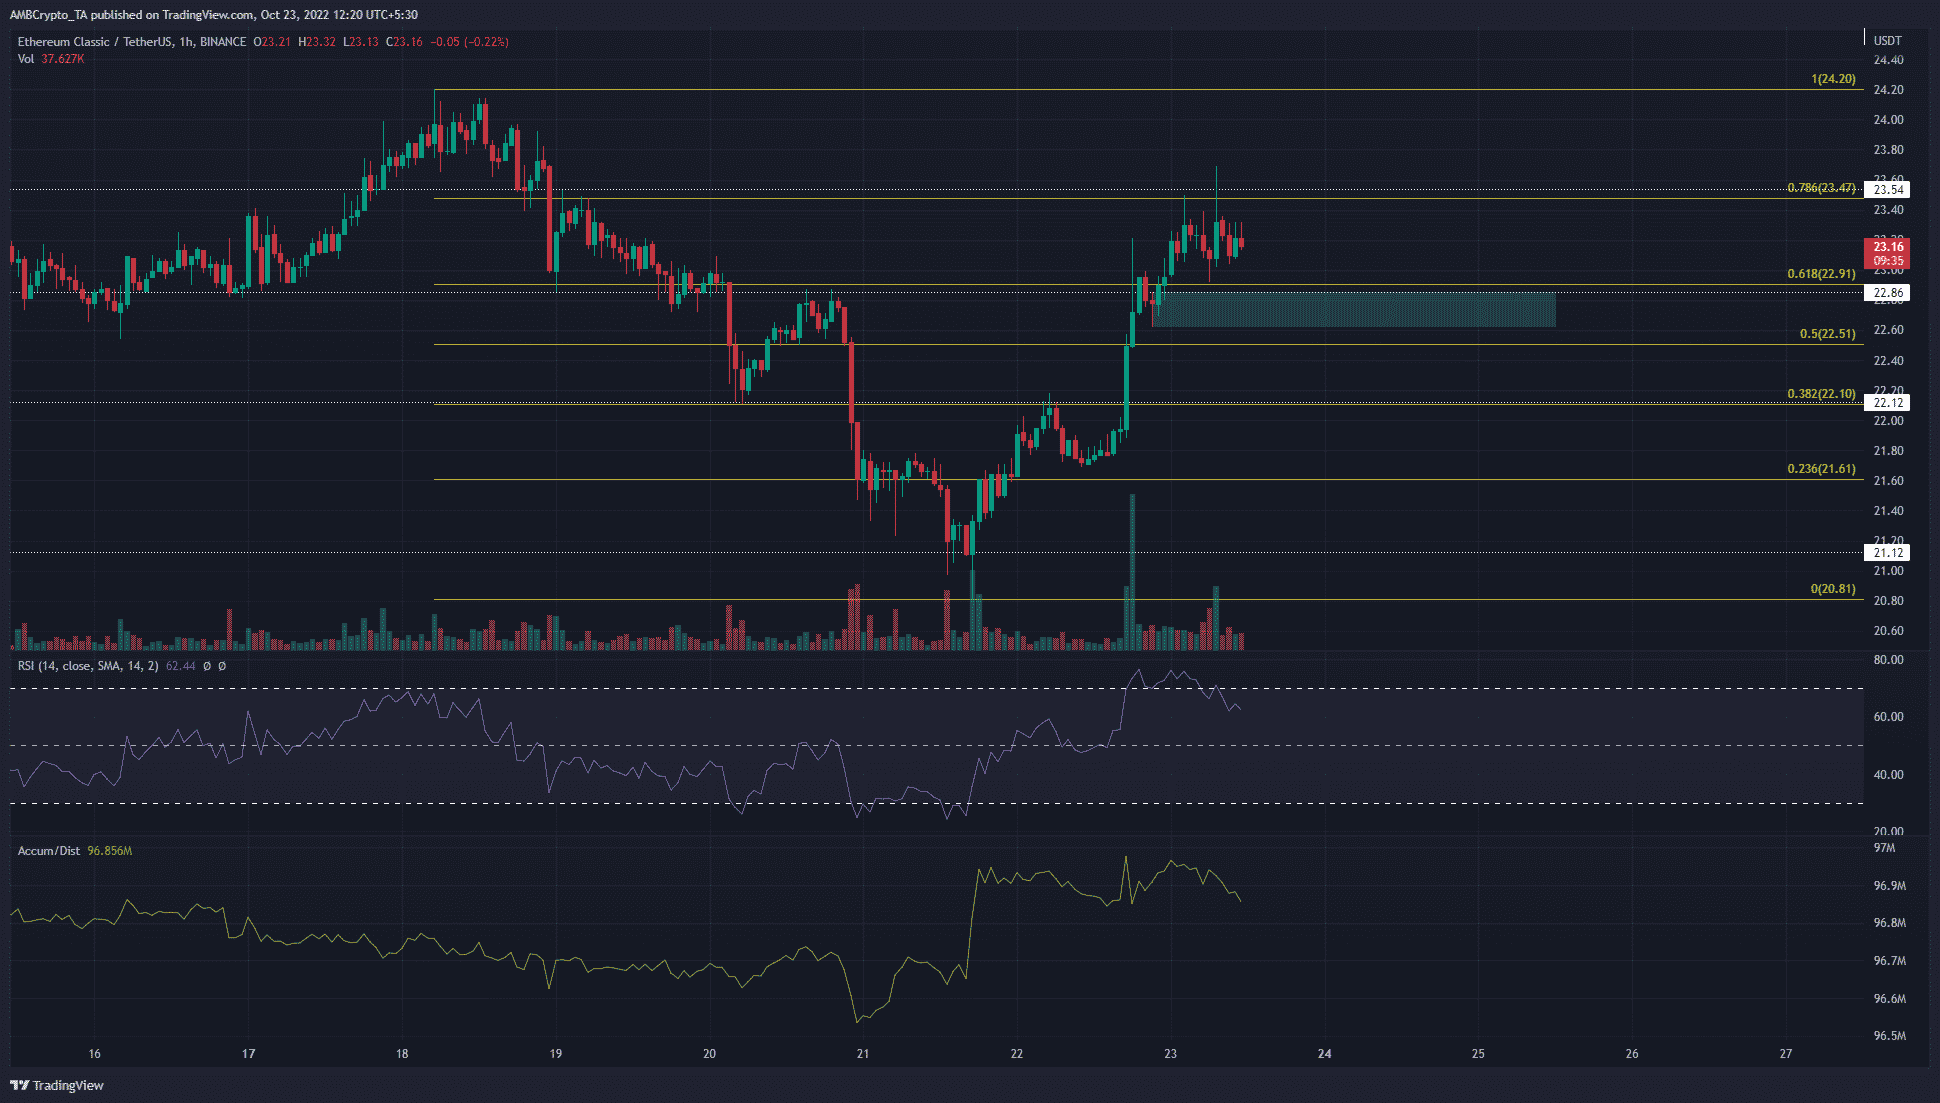
On the one-hour chart, we can see that the price broke above the $22.1 level. In doing so, it set a new higher high and shifted the short-term trend to bullish after a retest of the $21.7 mark as support.
During this time, the Relative Strength Index (RSI) managed to flip the neutral 50 line to support and rocketed into the overbought territory. At the time of writing, the RSI was slowly creeping lower, while ETC stayed near the $23.2 level. This suggested waning bullish momentum and the possibility of a minor pullback. The Accumulation/Distribution (A/D) indicator made higher lows over the past couple of days to show strong buying pressure.
On the four-hour and six-hour charts as well, the momentum was bullish for Ethereum Classic. However, the daily trend was bearish. The Fibonacci retracement levels (yellow) showed the 61.8% and 78.6% retracement levels to lie at $22.91 and $23.47. This golden pocket could serve as a stiff opposition to the bears.
A bullish order block on the one-hour chart was observed near the $22.86 level. This suggested that lower timeframe traders could look to buy a retest of this zone. However, a move below $22.6-$22.5 would likely mean that bears were in control once again.
Futures market participants bullish
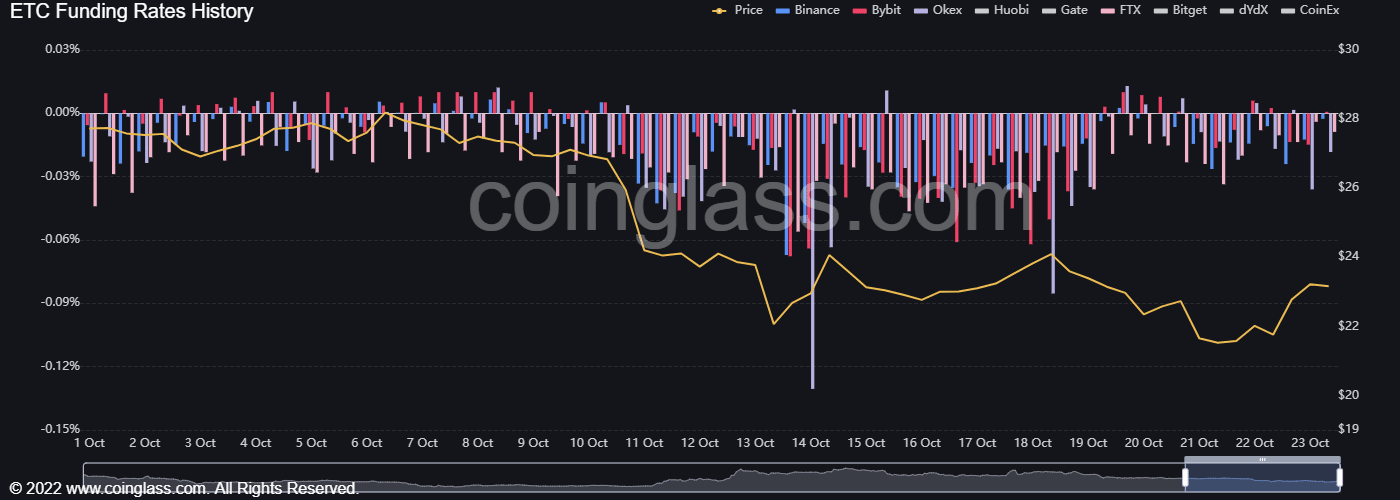
The funding rate has been negative over the past two weeks and highlighted that speculators had been strongly bearish. In the past few days, the funding rate began to move toward positive territory. Hence, there was a suggestion of a weakening bearish outlook in the futures market. The Long/Short ratio also showed ETC bulls to have a minor advantage in the last 24 hours at nearly 51%.
Ethereum Classic traded at an important resistance zone according to the Fibonacci retracement levels. Bullish momentum has stalled in recent hours. A move back below $22.5 would suggest the sellers were dominant once again.