
Ethereum registered a strong pullback as far south as $1,420 as this level of support was put to the test multiple times in the past few days. Cosmos held on to the $17-level at the time of writing, but had bearish momentum behind it. Finally, Vechain retraced a good part of its gains from the past few weeks.
Ethereum [ETH]
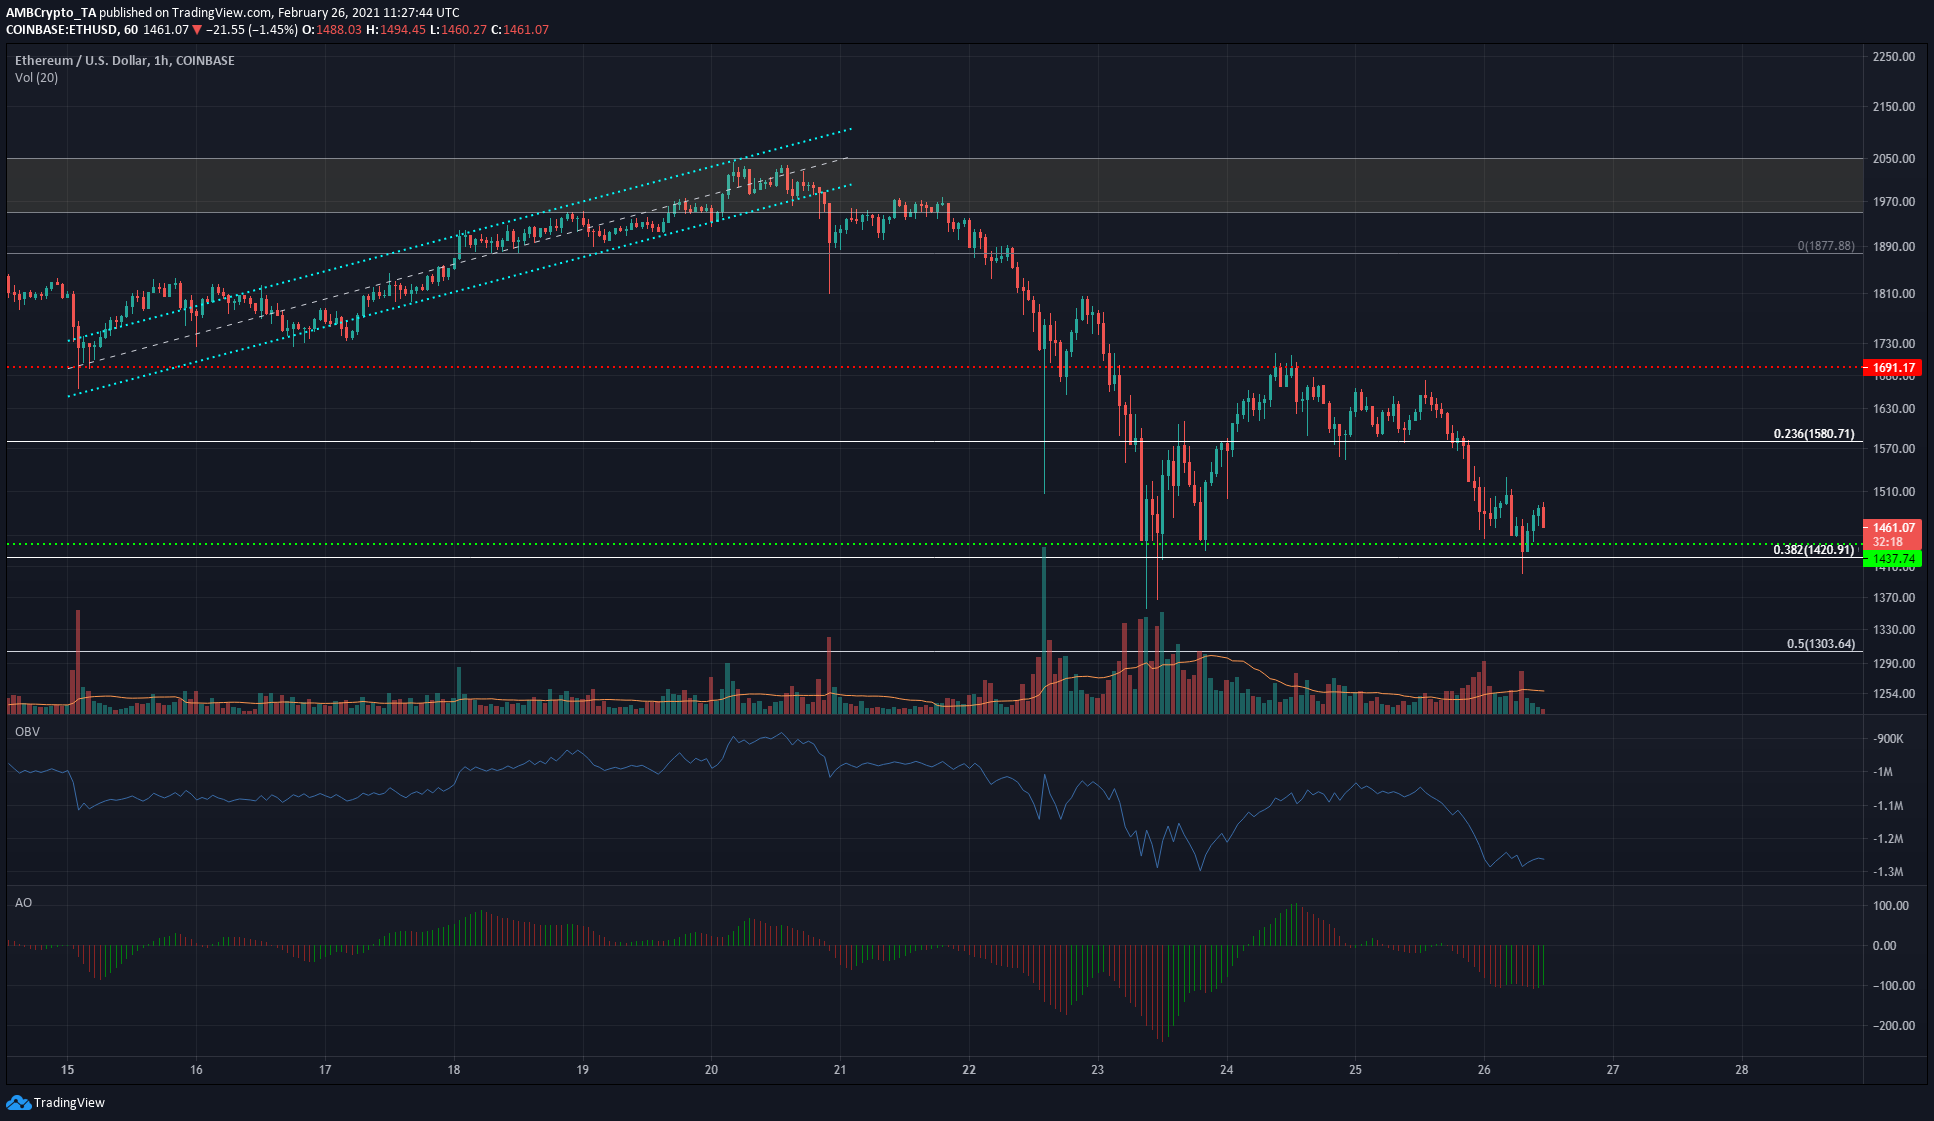
Source: ETH/USD on TradingView
Using the Fibonacci Retracement tool for ETH’s move up from $905 to $1877, some levels of retracement were highlighted as potential areas of support. The ascending channel’s (cyan) technical bearish target of $1700 was met and bears were able to drive the price even lower.
Over the past few days, ETH has already managed to test the $1420-level twice – weakening this level as a support. Dropping under this level would signal a move to $1300.
The OBV showed strong selling volume, while the Awesome Oscillator also remained firmly in bearish territory. Trading volume also rose in the hours when the price fell, underlining the strong bearish sentiment in the market.
Cosmos [ATOM]
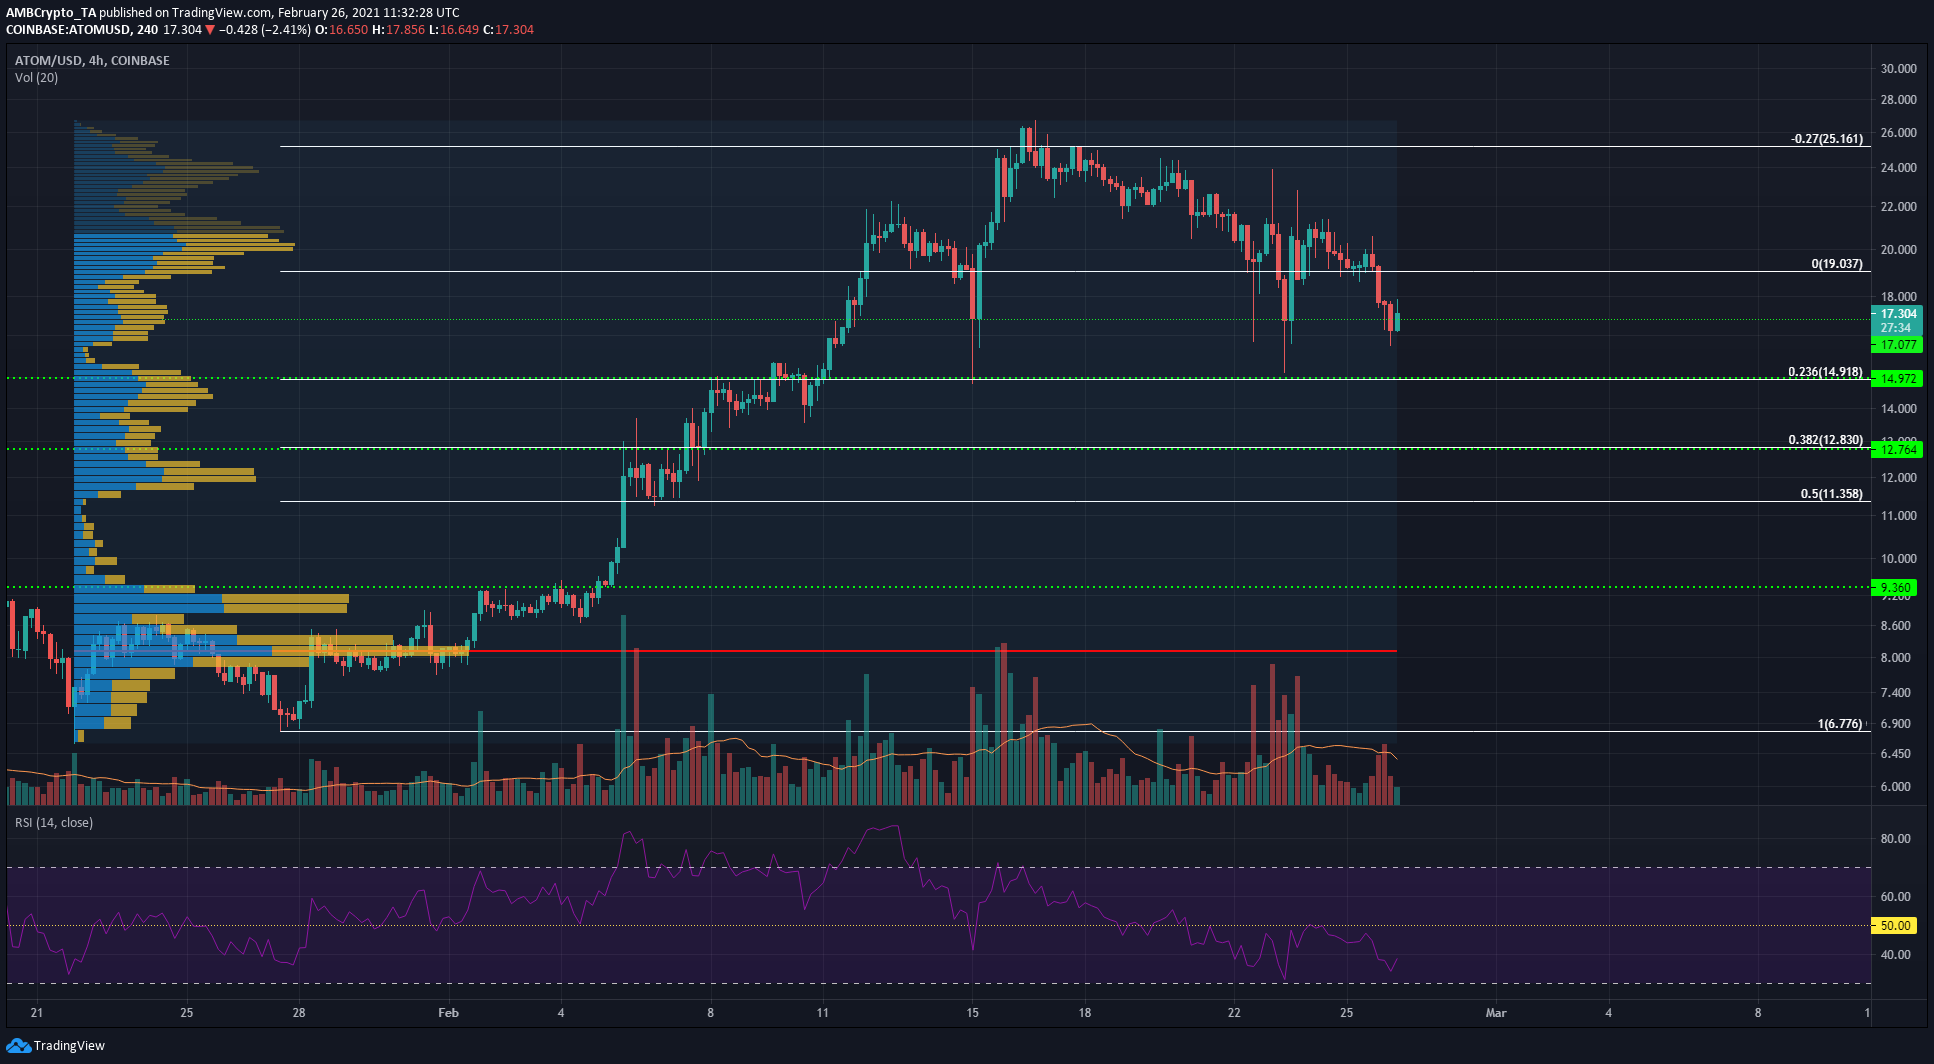
Source: ATOM/USD on TradingView
Using the Fixed Range Volume Profile, some areas of more voluminous trading activity were highlighted. These regions are generally the ones that pose resistance or lend support to the asset’s price.
For ATOM, under the $17-level was the $14.9-level of support. The volume profile indicator also highlighted that the $14.2-$15 region was likely to be one of demand.
The RSI sank below 50 and noted a value of 36.6 on the 4-hour chart, indicating strong bearish momentum. In the short-term as well, a trading session close under $17 was likely to see ATOM face further losses.
VeChain [VET]
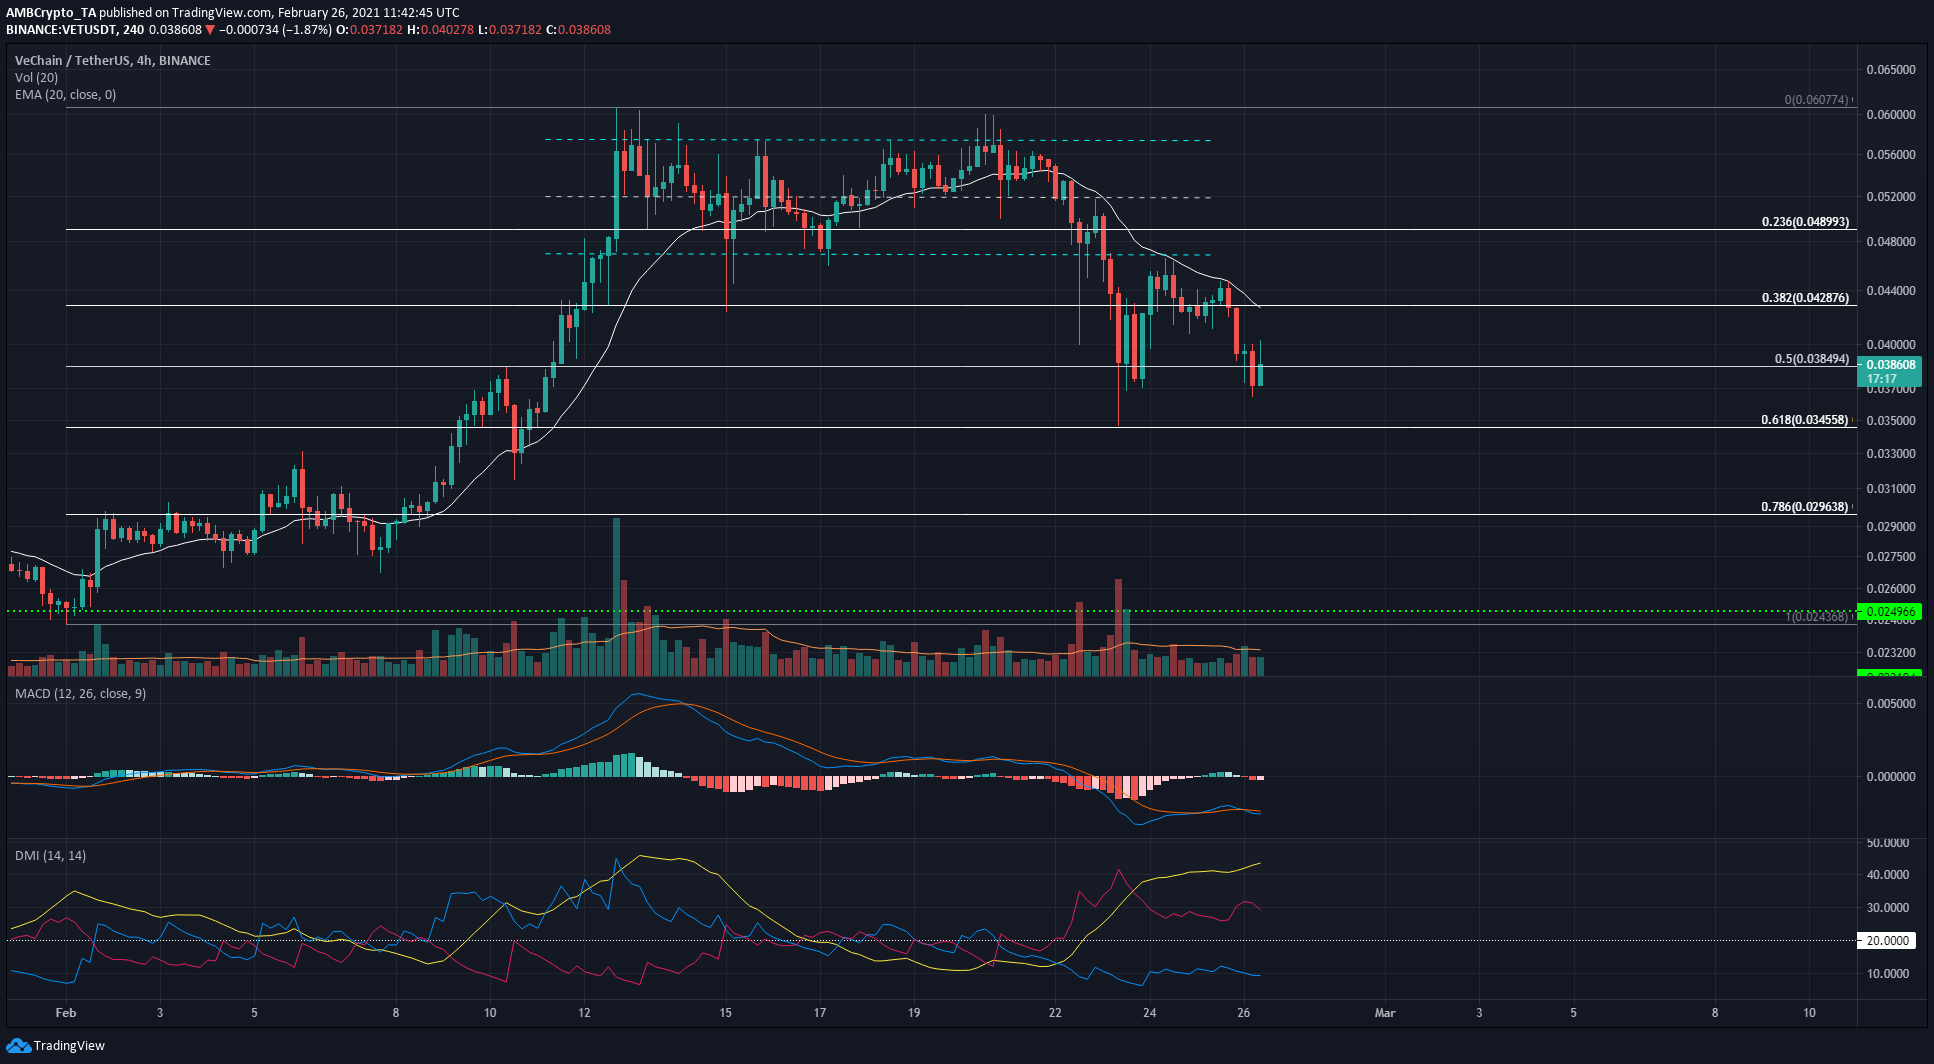
Source: VET/USDT on TradingView
The Directional Movement Index showed the onset of a strong bearish trend at the time when VET was on the verge of dropping beneath the rectangle top (cyan) pattern. Since then, the ADX (yellow) has continued to rise to underline further strength in the bearish trend. The MACD was also in bearish territory, giving a strong sell signal.
Using the Fibonacci retracement showed some levels of support for VET, with the 50% level at $0.038 coming under lots of selling pressure. Losing this level will quite likely see VET post further losses and move towards $0.0345 and $0.029.