Ethereum: Deflationary? Yes, but there is more that meets the eye
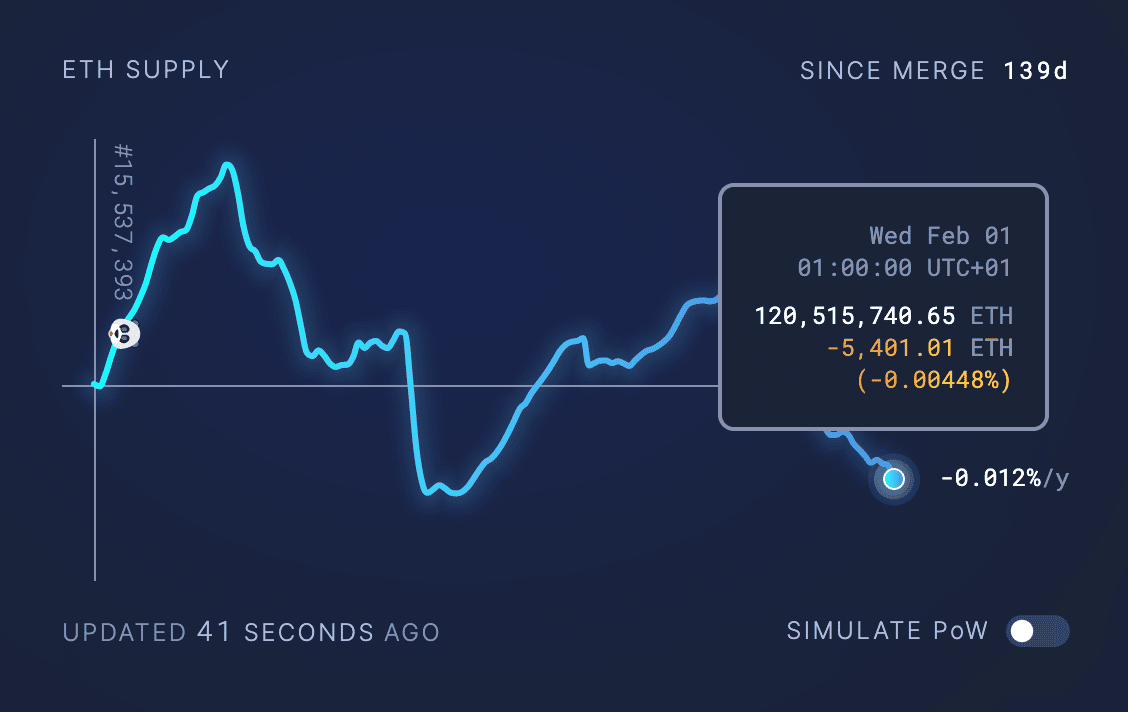
- In January, ETH’s supply decreased by 10,145.72 units.
- February might be marked by a price decline.
According to data from Ultrasound Money, in January, Ethereum’s [ETH] supply decreased by 10,145.72 units, resulting in a net deflationary value of approximately $16 million. As of this writing, the current total supply of ETH stood at 120,515,752, with an annual growth rate of -0.012%.
Read Ethereum’s [ETH] Price Prediction 2023-24
Ethereum: Deflation is the preferred option
The decrease in the supply of ETH has several implications for the cryptocurrency market. A decrease in supply leads to an increase in demand, as less of the asset is available for purchase. This can drive up the price of ETH, making it more valuable. Thus, the increase in demand could also attract more investors to the market, which could further boost the price of ETH.
Also, the net deflationary value of ETH could positively impact the currency’s stability. Notably, deflationary currencies maintain their value over time, as the decrease in supply creates a scarcity of the asset. This reduces the risk of inflation and can make the currency more attractive to investors, as it is less likely to depreciate.
Outlook is gloomy in the interim
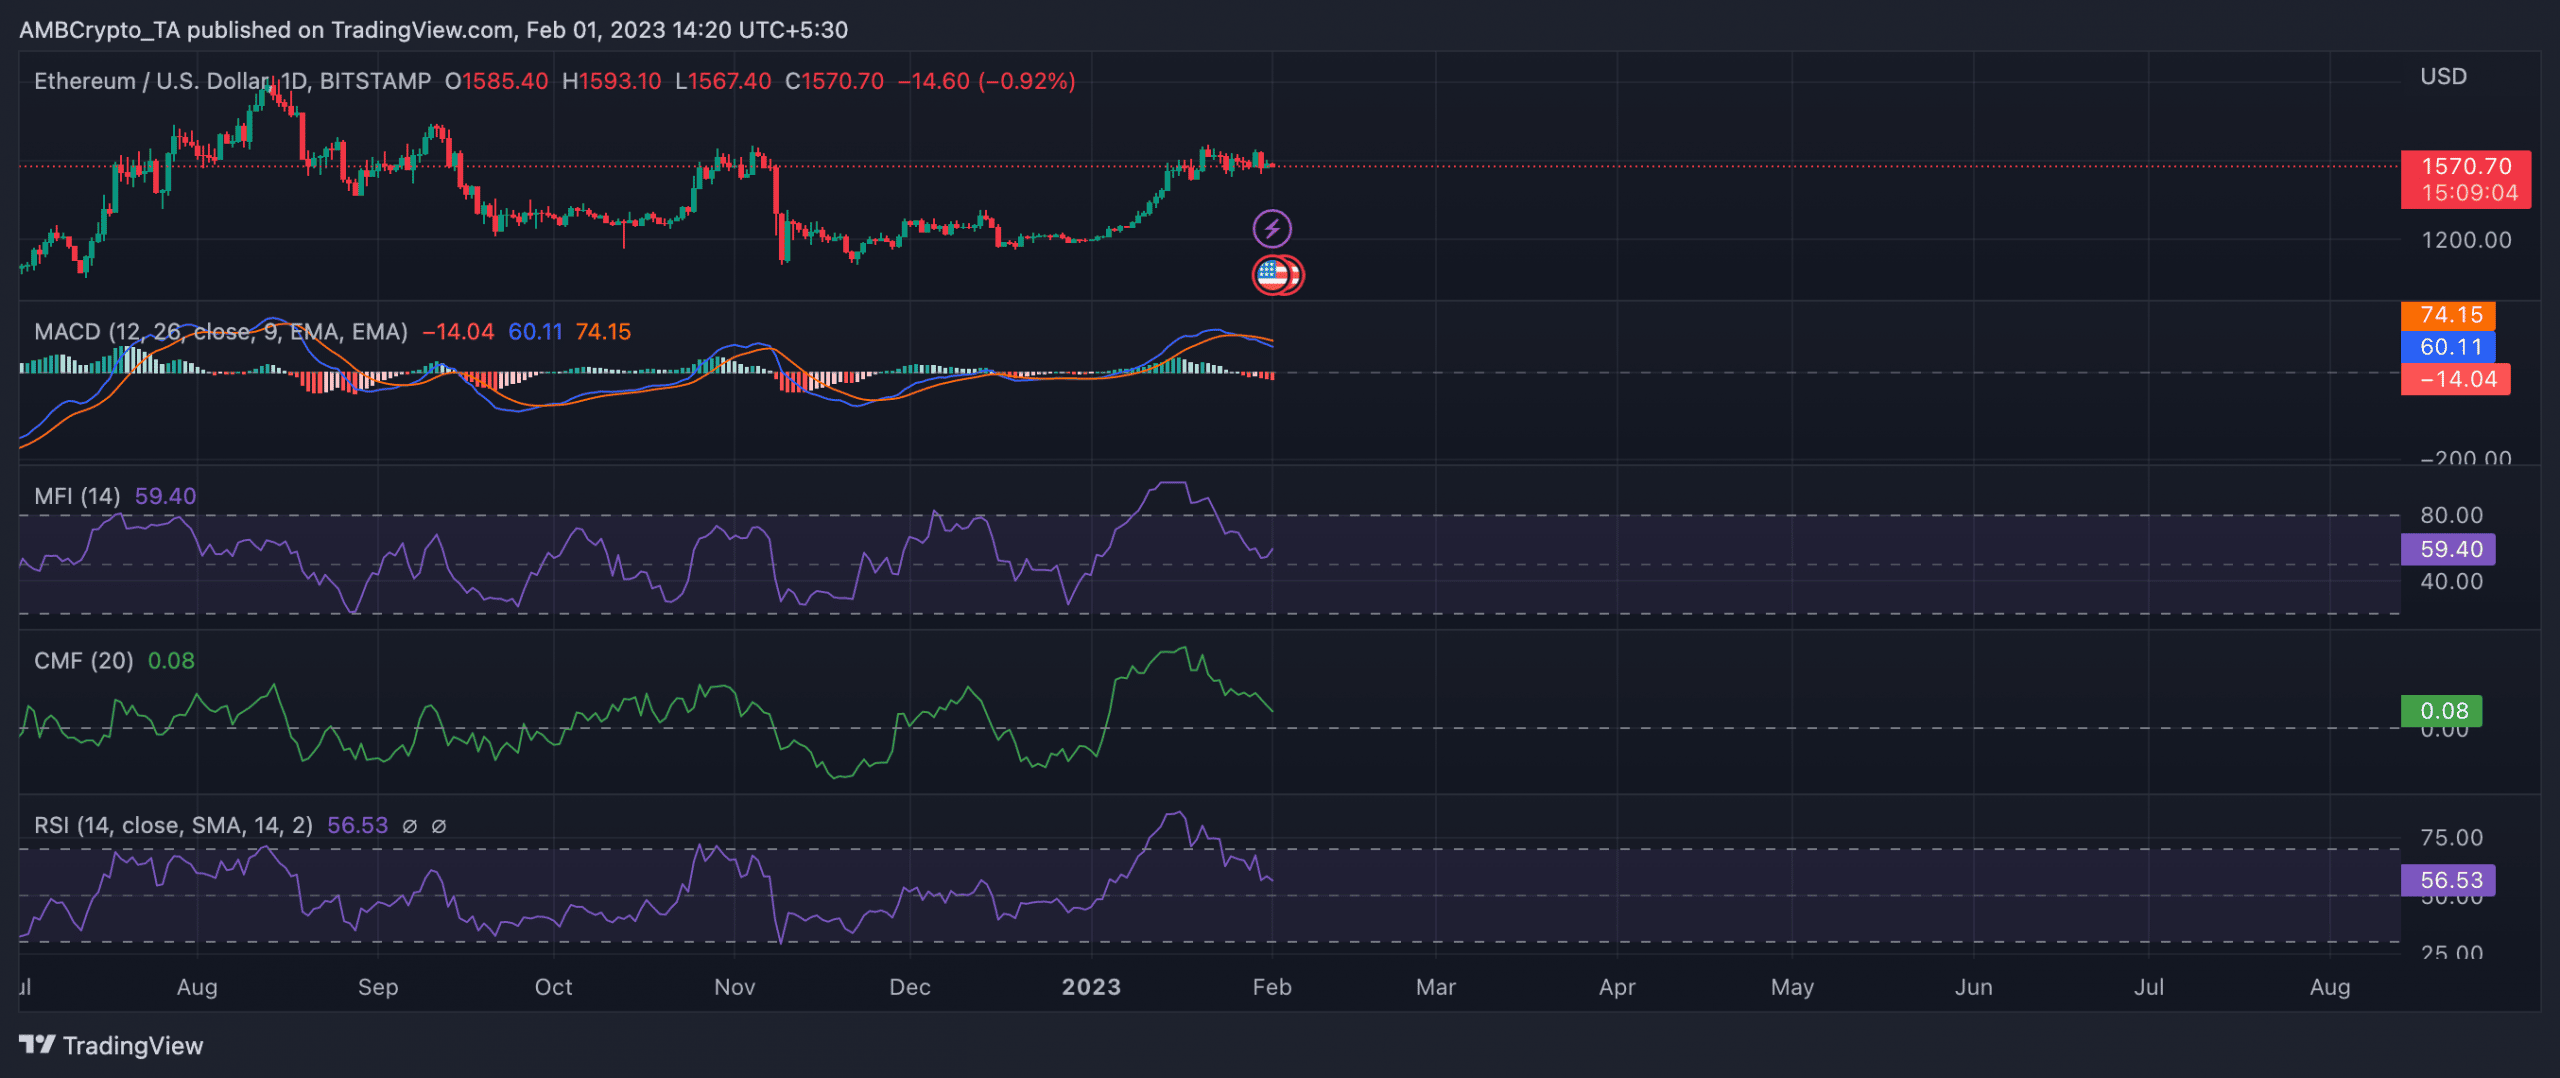
While ETH’s net deflationary value might ensure price stability in the long term, an assessment of price movements on a daily chart revealed that an imminent price reversal was on the horizon.
At press time, ETH traded at $1,569.93. In January, the altcoin’s value rose by 32%. However, as many investors rallied to take profits, buying pressure appears to have declined significantly.
A look at ETH’s moving average convergence/divergence (MACD) confirmed the commencement of a new bear cycle on 27 January. Since then, the indicator has returned only red histogram bars, and ETH’s price has fallen by 2%.
At press time, key momentum indicators aimed for their respective neutral zones. ETH’s Relative Strength Index (RSI) and Money Flow Index (MFI) have declined persistently in the last week and remained in downtrends at 56.33 and 59.40, respectively, at the time of writing. A drop in ETH accumulation marked the past week, and many took to selling their holdings.
Likewise, the dynamic line (green) of the coin’s Chaikin Money Flow (CMF) aimed to cross into the negative zone. Many investors shied away from buying more ETH.
How many ETHs can you buy for $1?
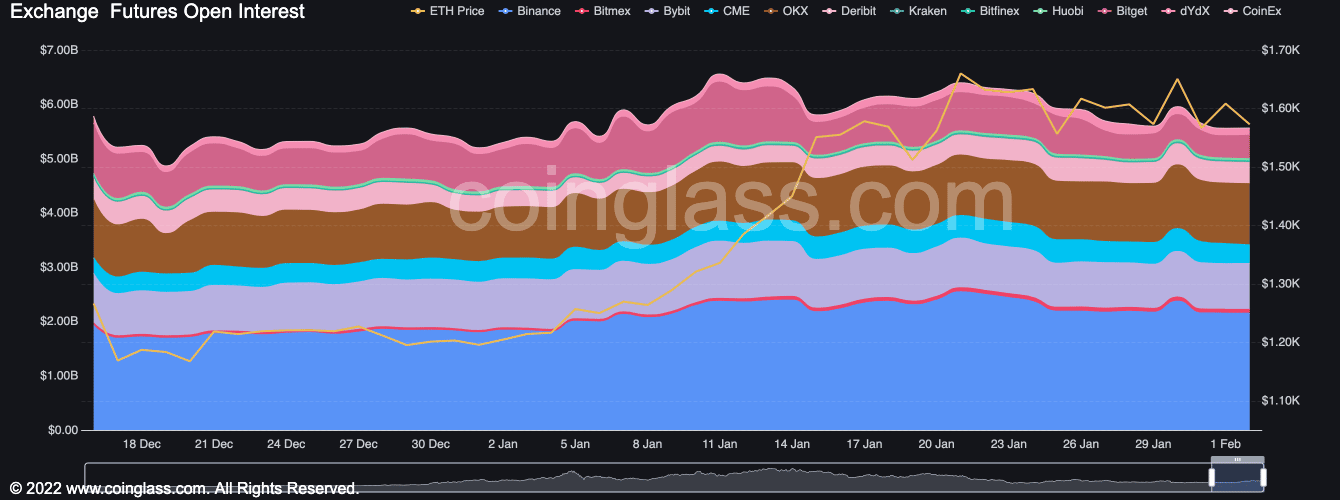
The lack of new demand for ETH was depicted by a consistent decline in its Open Interest in the past ten days, data from Coinglass revealed. Within that period, ETH’s Open Interest fell by 16%.
Typically, a decline in an asset’s Open Interest means that traders are closing out their positions and there is a decline in new contracts being created. This suggests that they are becoming less confident in the future price movements of the asset and are reducing their exposure.