Ethereum, Dogecoin, MANA Price Analysis: 24 December

As Bitcoin re-enters the $51,000 zone, Ethereum crossed the $4000-mark again while Dogecoin managed to breach the 23.6% Fibonacci resistance. Also, MANA snapped off the $3.64-mark.
However, the overall trend still needed to be supported with high volumes to confirm a strong reversal.
Ethereum (ETH)
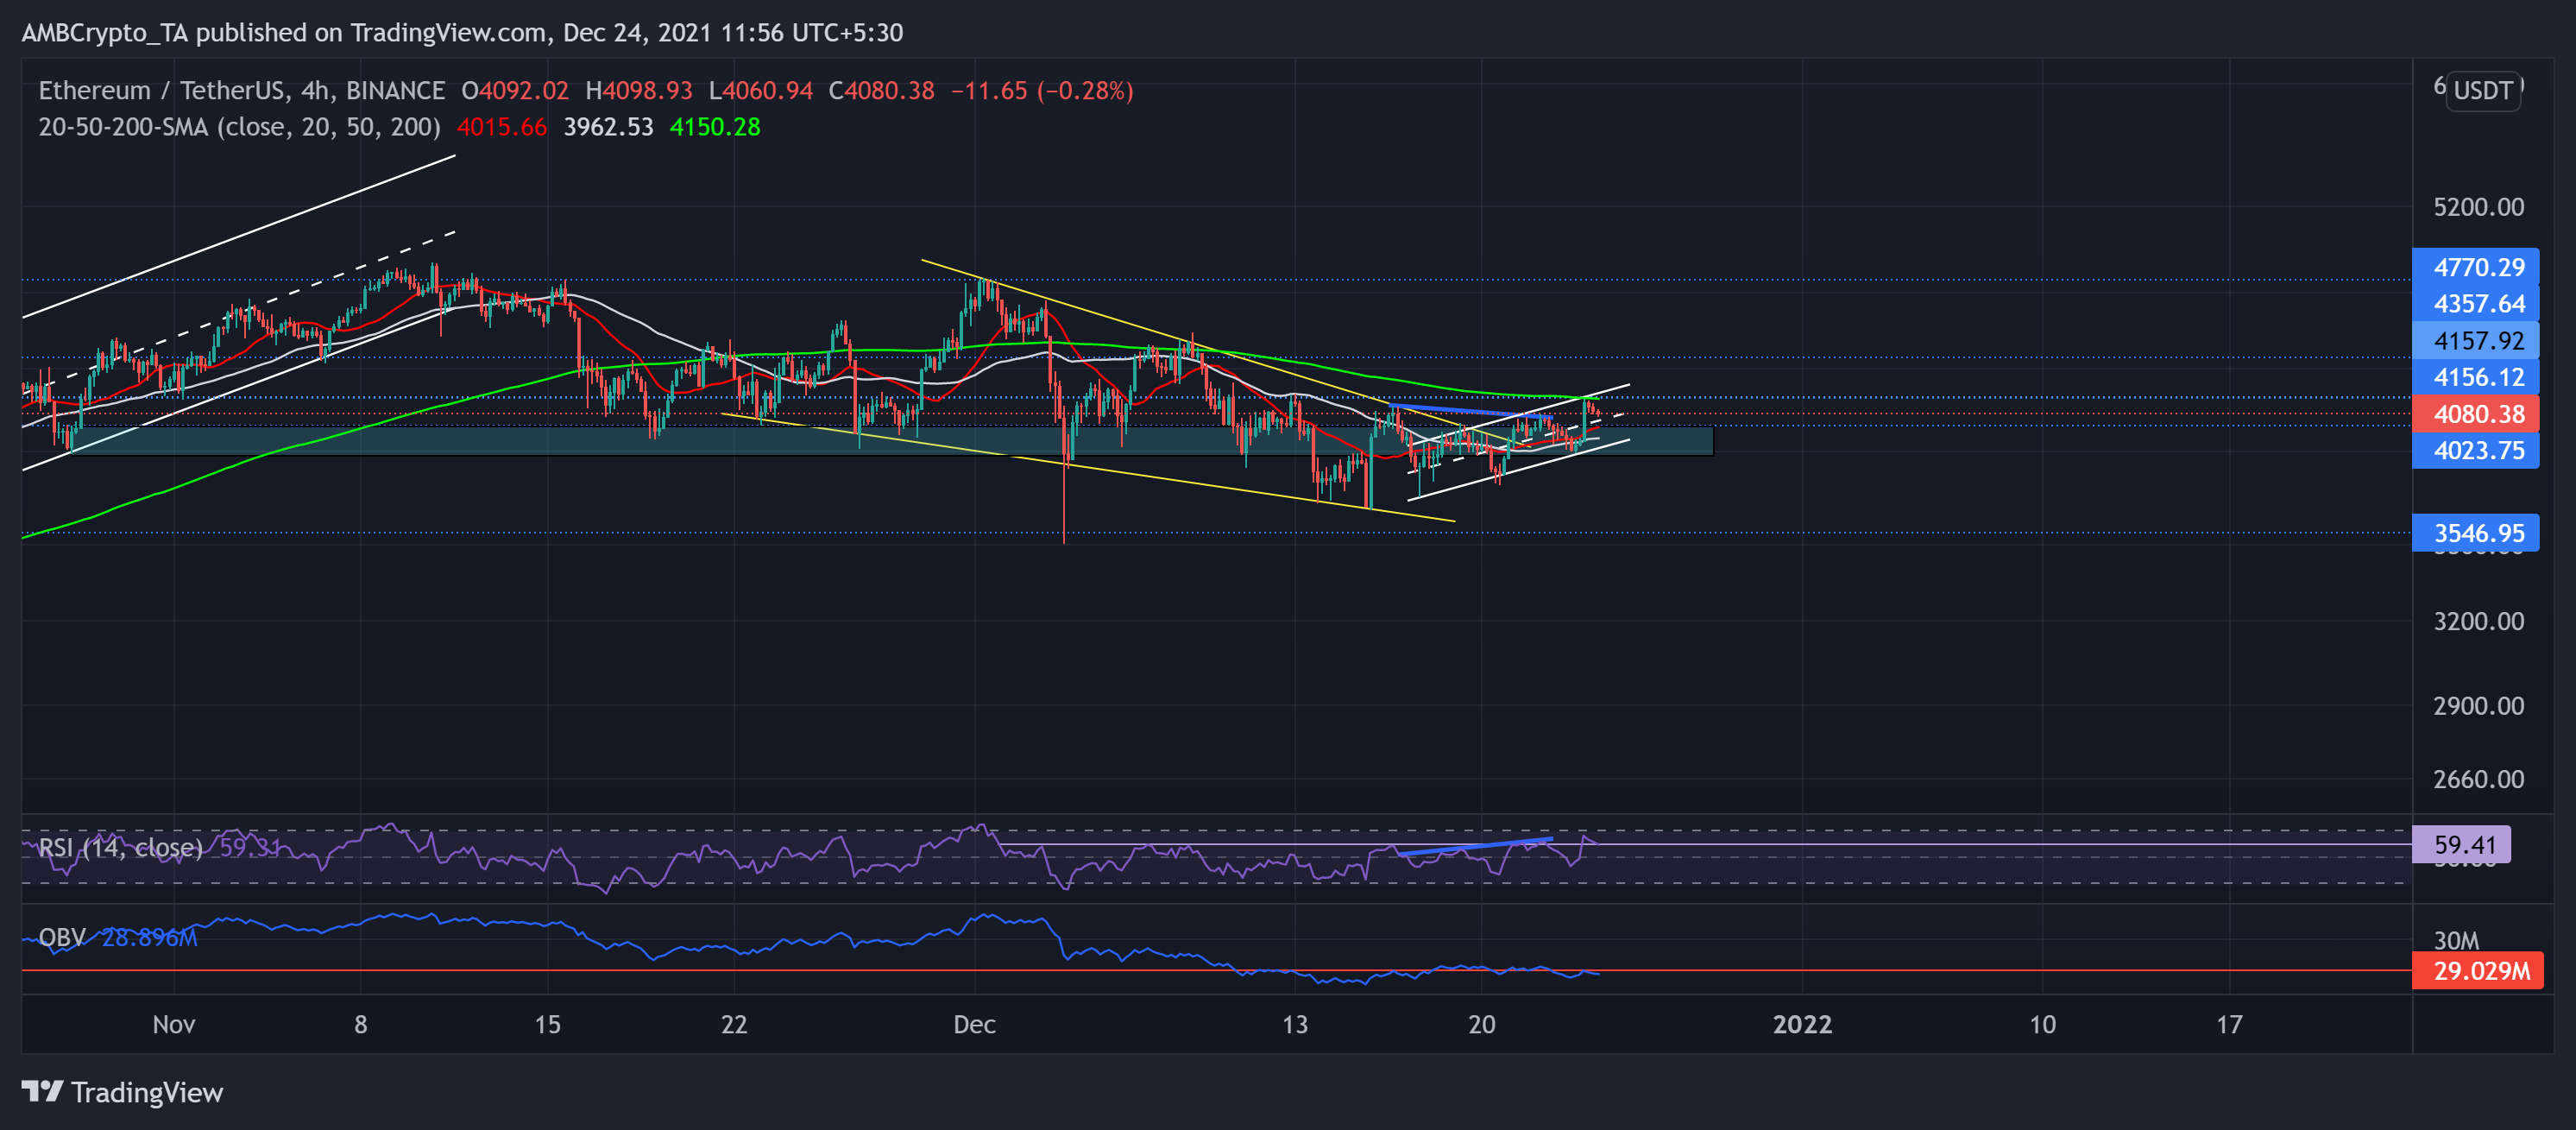
On its 4-hour chart, ETH broke out after a month-long falling wedge as the trend reversed by forming an up-channel (white) over the past week. The largest altcoin saw an expected pullback after a bearish divergence (between RSI and price action, blue).
ETH’s demand zone and the lower channel supported this pullout as the price bounced back from it. As a result, it saw a 6.3% jump on 23 December as the bulls snapped off the $4,000-level. They managed to sustain the price above this level after testing it for the fifth time in the last 10 days.
Now, the immediate resistance stood at the $4,156-level that coincided with the upper channel and the 200-SMA (green).
At press time, ETH traded at $4,080.38. The RSI breached the 59-mark for the first time since 1 December but saw a sharp plunge after some loosening signs. However, The OBV did not seem to keep up with the uptrend as it was historically higher at the $4,150-level.
Dogecoin (DOGE)
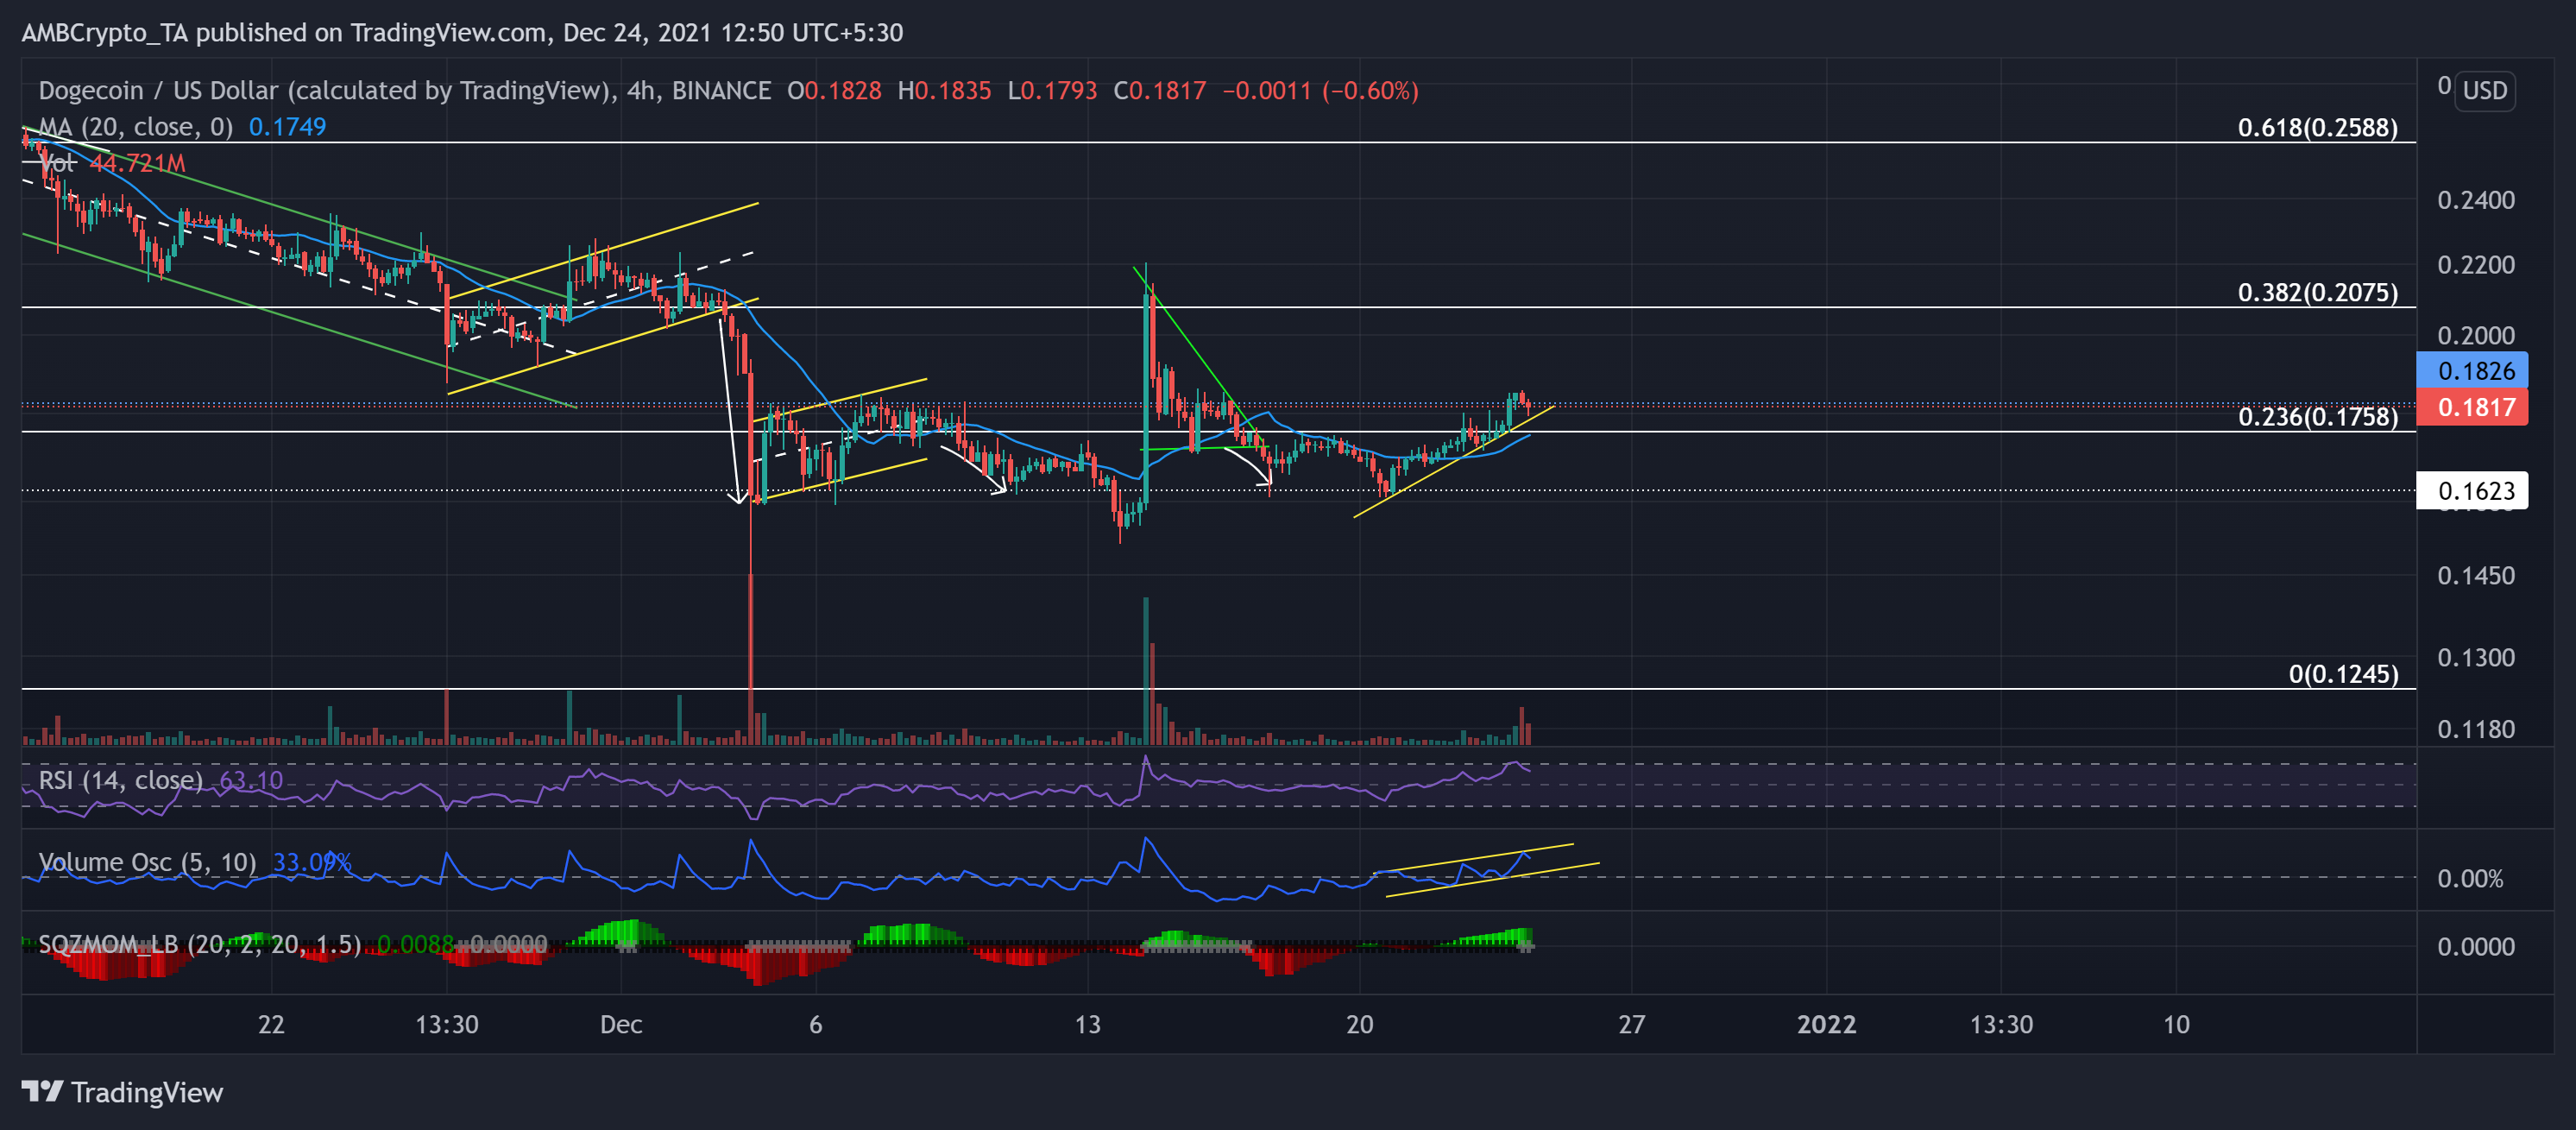
Over the past day, DOGE crossed its 23.6% Fibonacci resistance after a 6.23% incline from the 22 December low. The bulls seemingly gained more force after Elon Musk yet again favored the meme-coin in a tweet response.
But the rally halted at the $0.182-mark immediate resistance, ensuring the previous oscillating range ($0.162 to $0.182). Considering the uptrend on the Volume oscillator, DOGE could find immediate support at the trendline (yellow). However, the recent pullback volumes have been higher than the incline volumes. Any further breakdown could see support at the 20-SMA (blue).
At press time, DOGE traded at $0.1817. The RSI saw a dip from the overbought region and stood at the 61-mark. The Squeeze Momentum Indicator flashed grey dots, hinting at a high volatility phase.
MANA
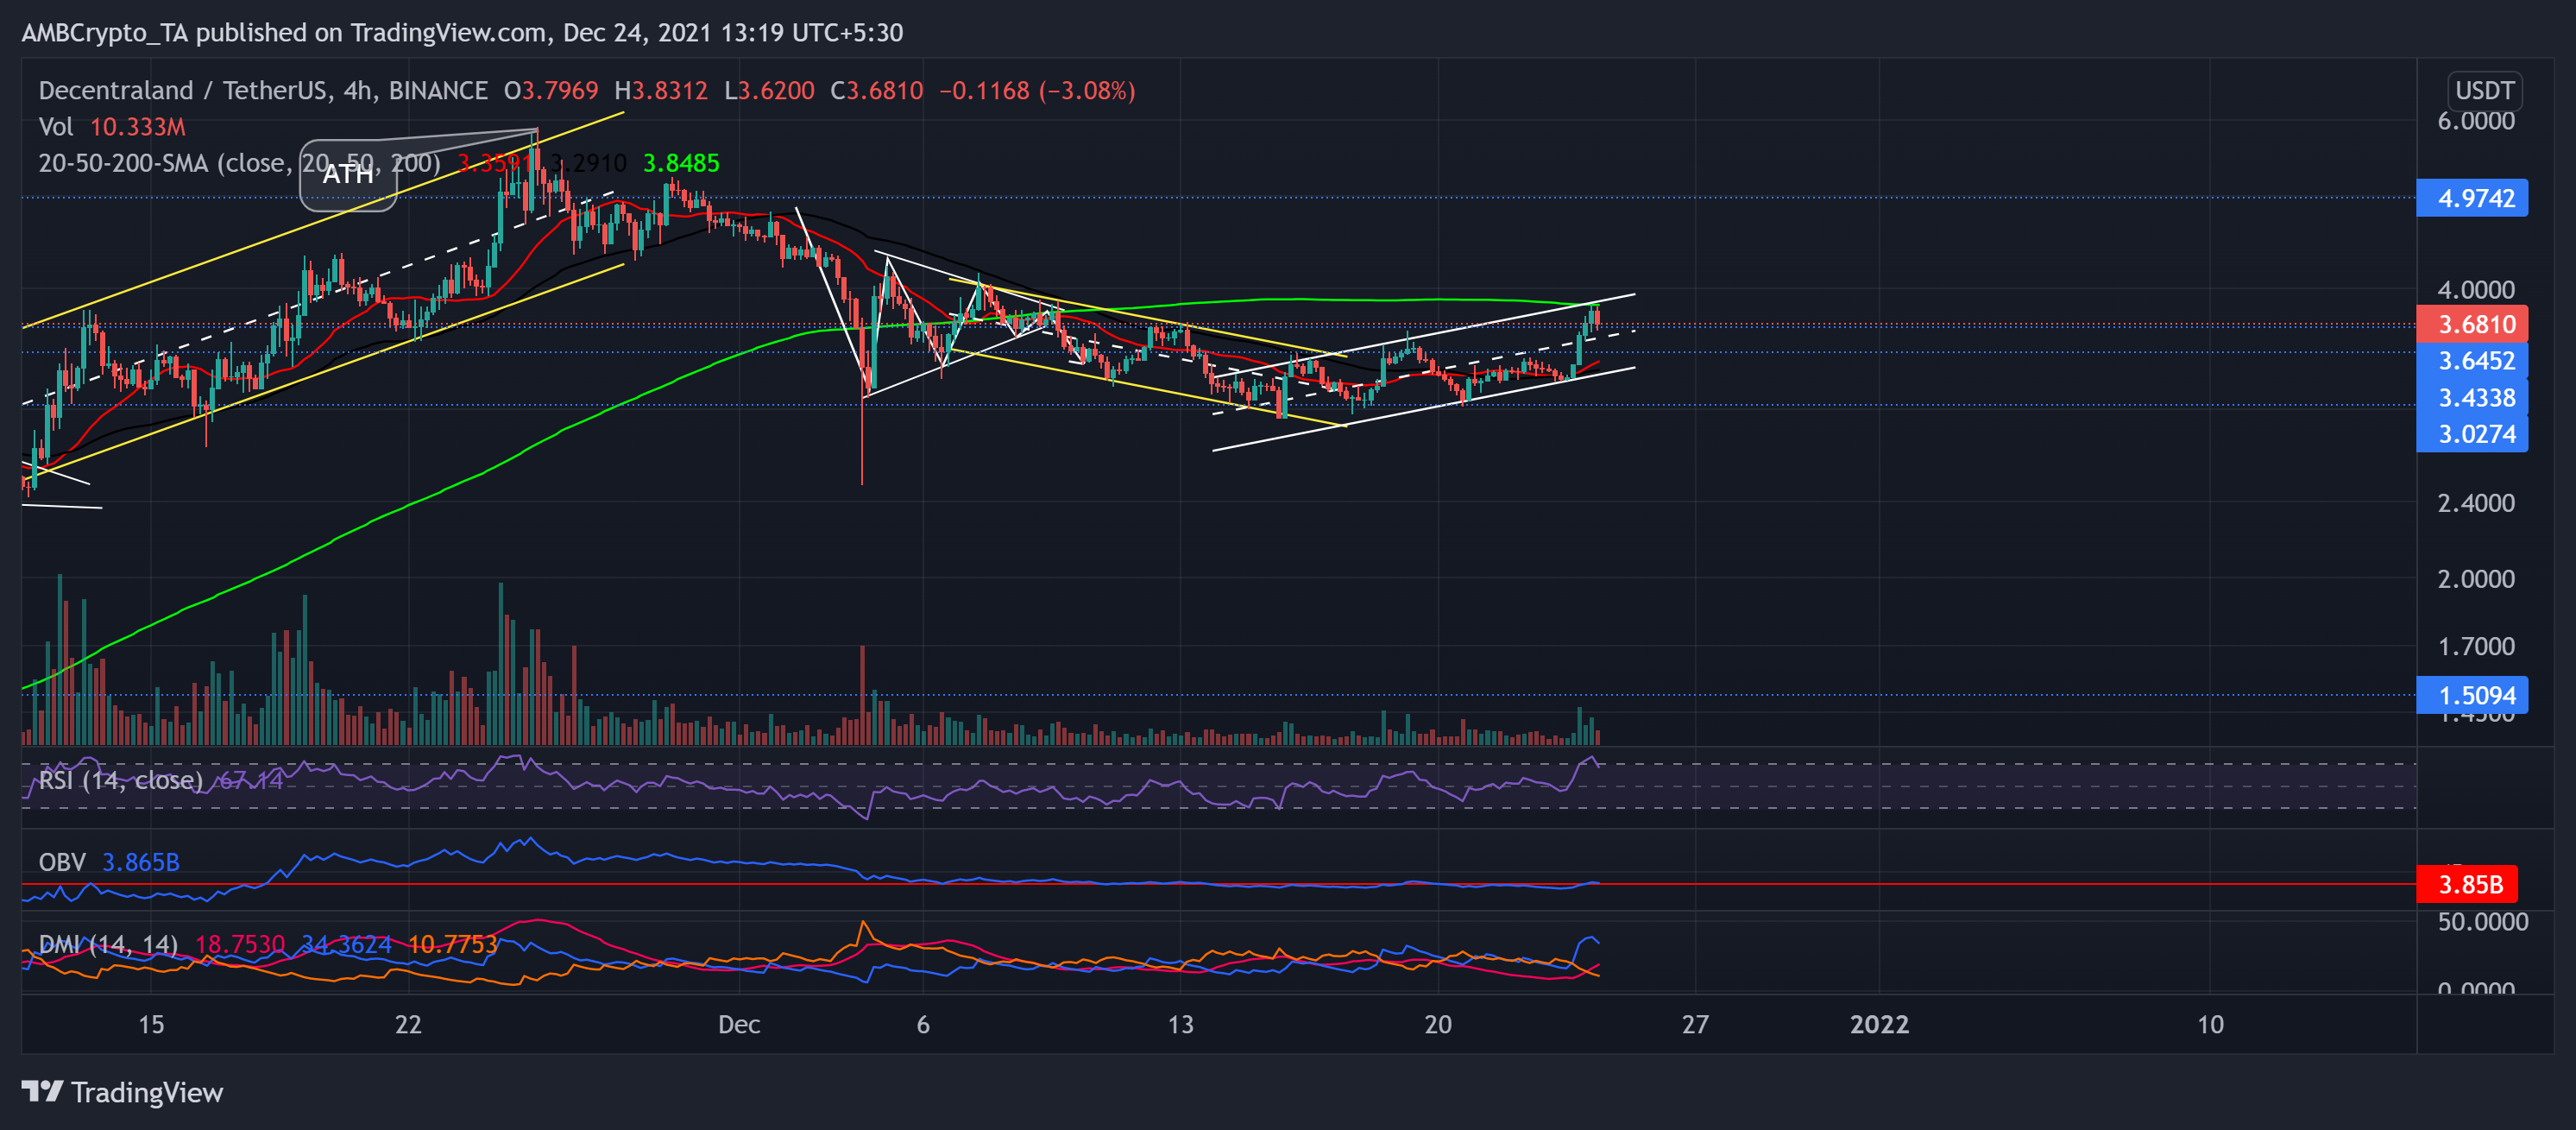
MANA halted its downturn at its one-month support at the $3.02-mark. The alt saw a persistent decline after striking its ATH on 25 November. As the price bounced from this level, it saw an up-channel over the past week.
On 23 December, the alt marked a 19.49% jump breaching the $3.64-level two-week support (previous resistance). Then, it saw a pullback as the upper channel coincided with the 200-SMA (green) and assumed strong resistance.
At press time, MANA traded at $3.681. The RSI saw a 20 point surge toward the overbought region and showed reversal signs now. However, the OBV did not spike enough to match its previous high at the same price point.


