Ethereum, Dogecoin, VeChain Price Analysis: 17 January

While the ‘Extreme fear‘ sentiment refuses to flip, Dogecoin retraced nearly half of its previous rally and breached its bullish trendline support in the near term.
Ethereum and VeChain flashed a low volatility phase as they moved sideways after their patterned breakouts. Their near-term technicals preferred the bears.
Ether (ETH)

The bearish rally seemed to slacken after ETH bounced back from its long-term 61.8% Fibonacci level. After poking its 15-week low on 10 January, the king alt grew by over 10% in the past week.
This growth helped it breach the down-channel (white) but saw a pullback from its immediate supply zone (rectangle, yellow). It also becomes crucial to take note of the lower peaks on the Volume Oscillator, indicating the weakness of its weekly gains.
Furthermore, it started to flash bearish signs after the most recent red candlestick engulfed the previous green candlestick. The $3,239.8-zone is vital for the buyers to step in to prevent a further downfall.
At press time, the alt traded at $3,250. After bullishly diverging with price, the RSI failed to sustain itself above the midline. It tested the 43-level support and flashed a selling bias. Nevertheless, the ADX displayed a weak directional trend for ETH.
Dogecoin (DOGE)

The 5 January sell-off propelled DOGE to lose its $0.1675-support after the bears retested it multiple times in a side-channel (white). After which, the alt saw a 19.6% breakdown and poked its five-week low on 10 January. Since then, DOGE saw a solid recovery after registering an over 55% ROI until 14 January.
However, the bears ensured the $0.1919-mark resistance as the price retreated by over 20% in the last three days. Now, the immediate testing point for the bulls stood at $0.1739-mark.
At press time, DOGE traded at $0.1704. Talking about RSI, the 33 point plunge in the last three days pulled it below the midline while it displayed a bearish bias. Also, the CMF was below the zero-line, hinting at decreased money inflows. However, the OBV managed to maintain its heightened level.
VeChain (VET)
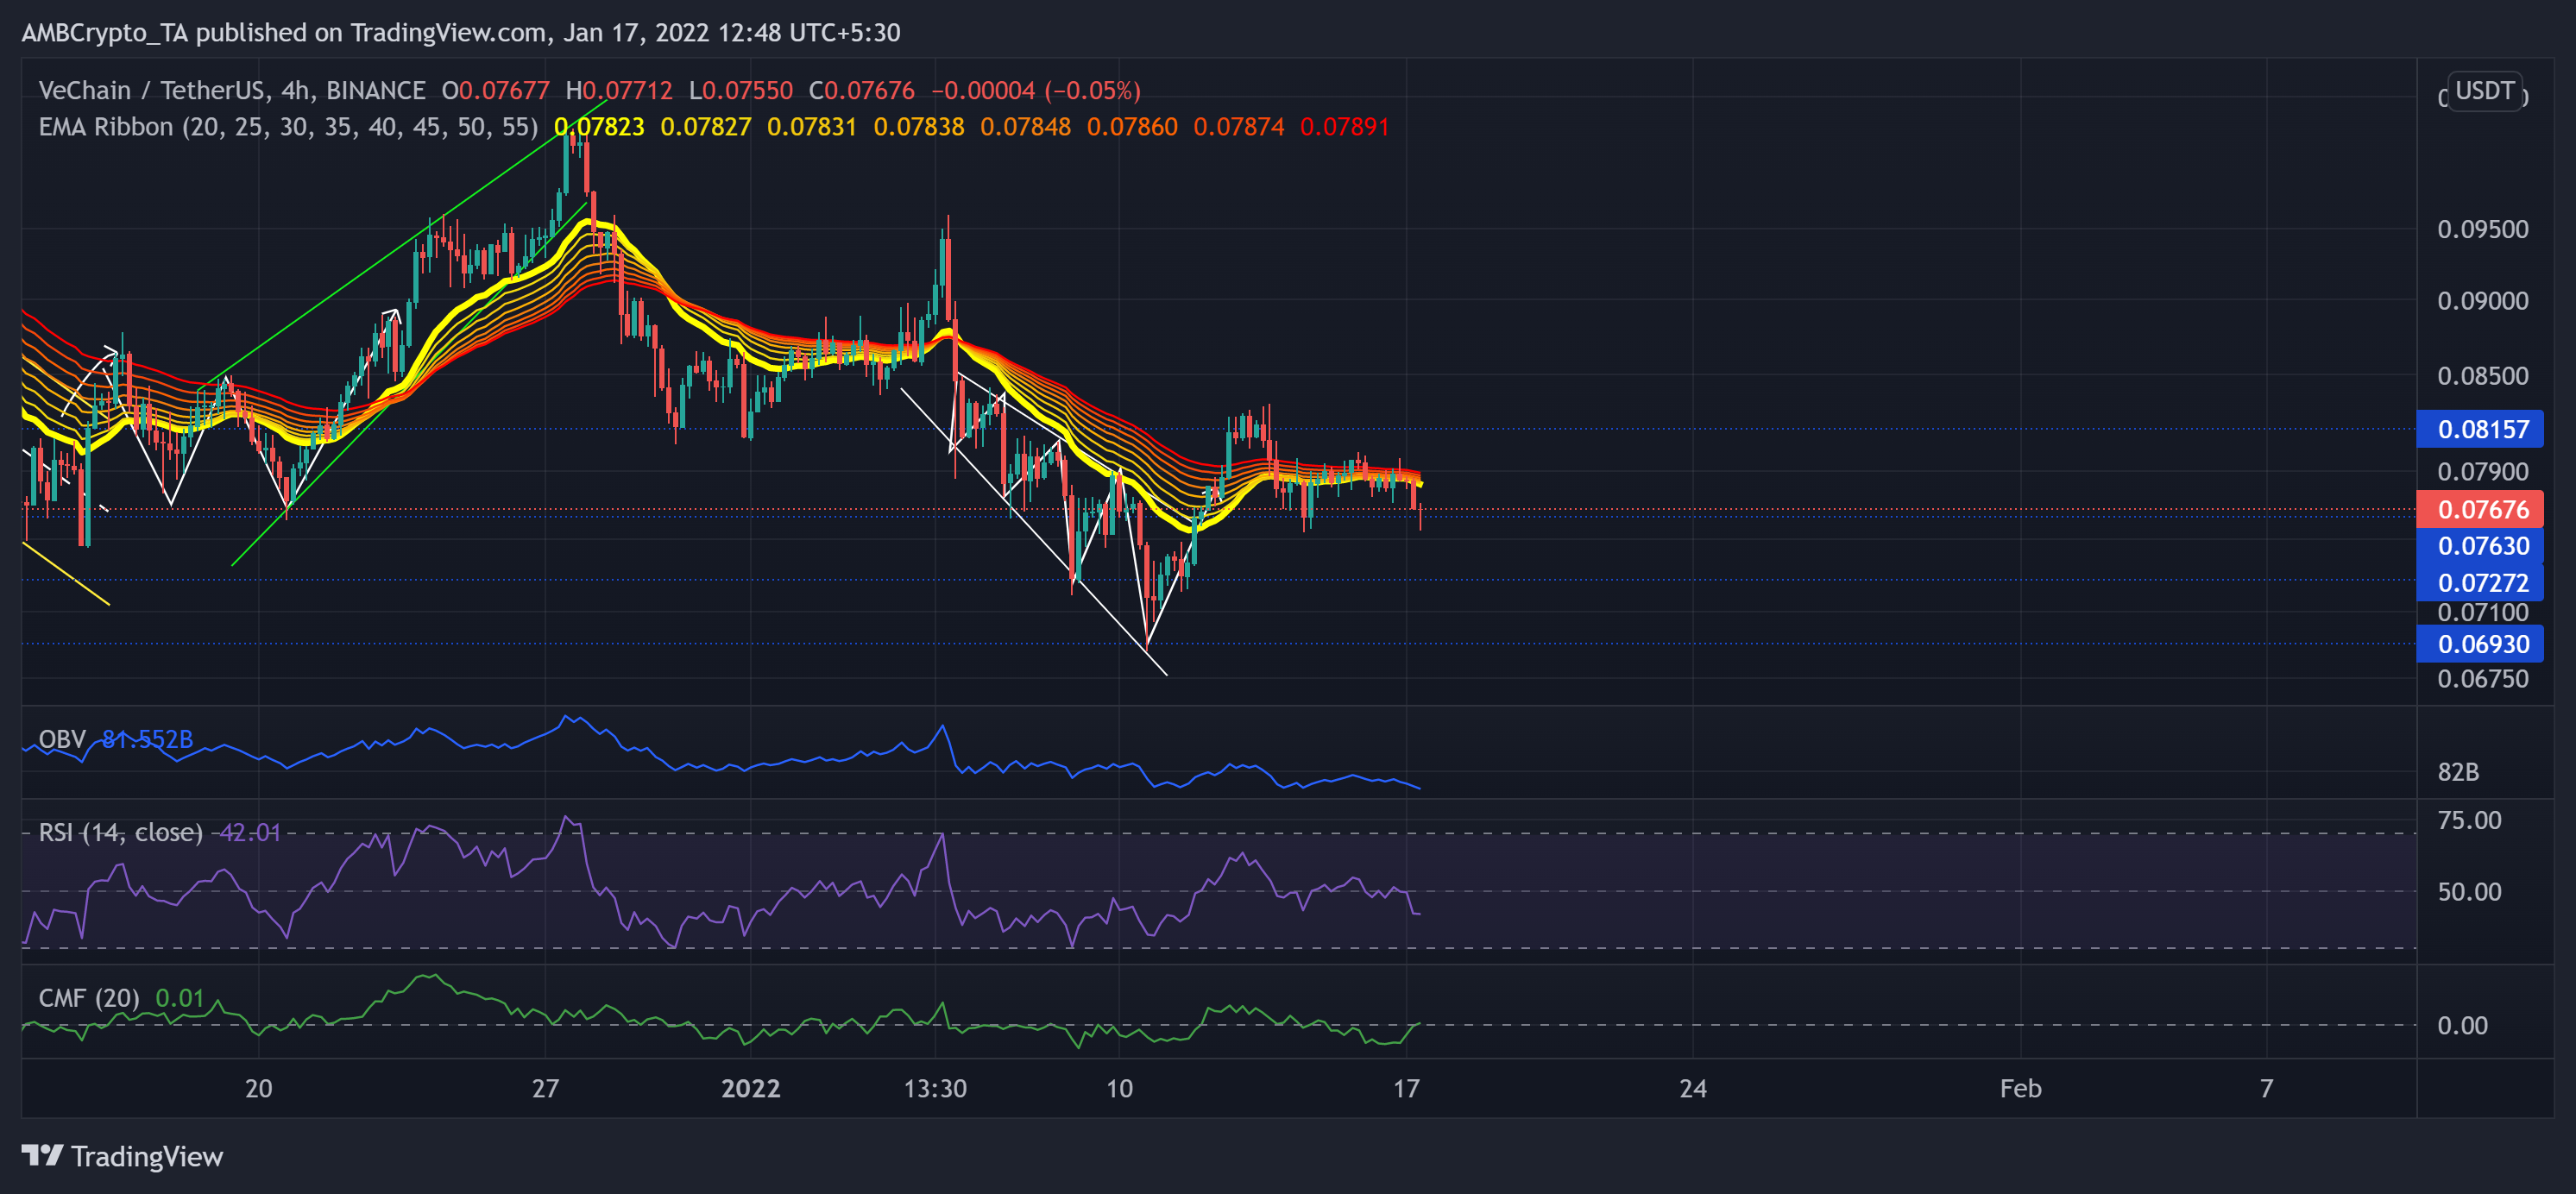
VET clawed back to reclaim the $0.076-mark support after an impressive 19.5% gain (from 10 January low) until a reversal from the $0.08-resistance.
This gain helped VET close above its EMA Ribbons. But the bears were quick to respond and pull it back toward the $0.0763-mark support. Now, the OBV could not match its previous levels at the same price point. This reading indicated a weak bullish move.
At press time, the alt traded at $0.07676. The RSI exhibited a bearish inclination as it moved sideways below the midline. Nevertheless, the CMF depicted improved money volumes as it crossed the zero-line after a near-term uptrend.


