Ethereum [ETH]: $2K-level does not seem far off, thanks to…

Ethereum [ETH] finally sustained its bullish track as its recent rallies altered the long-term trend to exhibit a buying edge. With the 200 EMA assuming a rebound zone for the bearish pulls, the king alt now saw a volatile break above the point of Control (POC, red).
In the four-hour timeframe, the two-week trendline resistance (white) coincided with the $1,900-zone ceiling to create a near-tern barrier.
Should this resistance stand sturdy, it could reject higher prices for a while before a likely bull revival. At press time, ETH traded at $1,886.5, up by 11.22% in the last 24 hours.
ETH 4-hour Chart
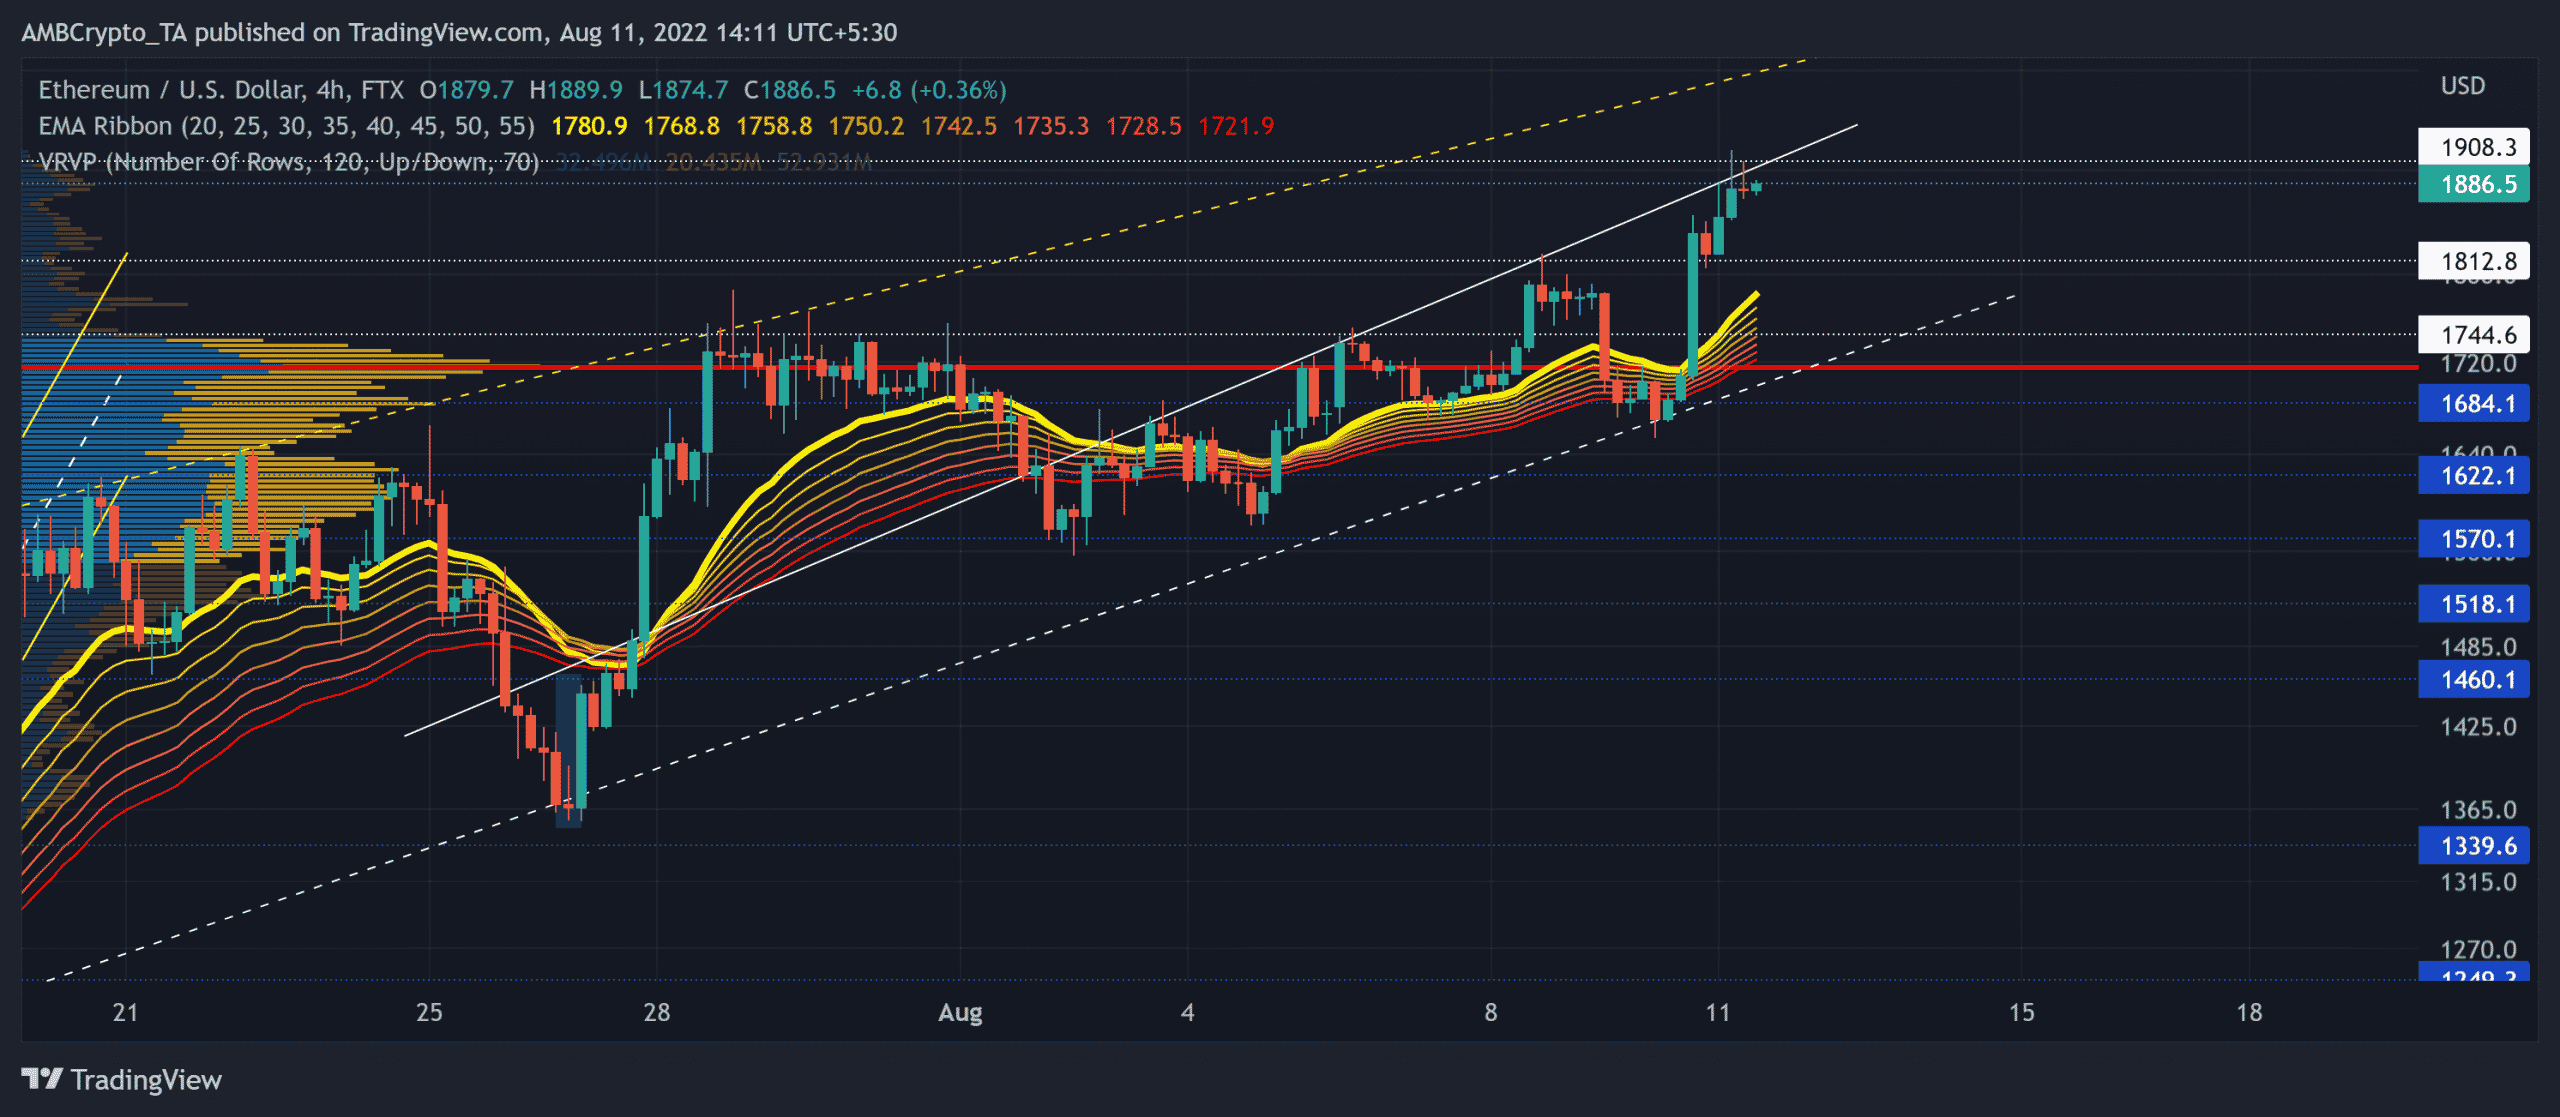
ETH’s growth in the last month has expedited the altcoin’s efforts to change the broader narrative in favor of bulls. As a result, the EMA ribbons have been northbound while supporting ETH’s 87% revival from its mid-July lows.
Furthermore, the recent buying comeback entailed the alt’s growth toward its two-month high on 11 August.
But with the bears posing hurdles near the $1900 region, ETH saw a slight rejection of higher prices. Meanwhile, ETH saw a nearly 60% incline in trading volumes in the last 24 hours. This increase has further reaffirmed the near-term bullish strength.
A rebound from the $1,900 level can help the bears retest the $1,812-$1,744 range in the coming sessions. Whereas, an eventual break above the trendline resistance could pave a path for a test of the two-month trendline resistance (yellow, dashed) before a plausible slowdown.
In this case, the potential target would lie in the $1,990 zone.
Rationale
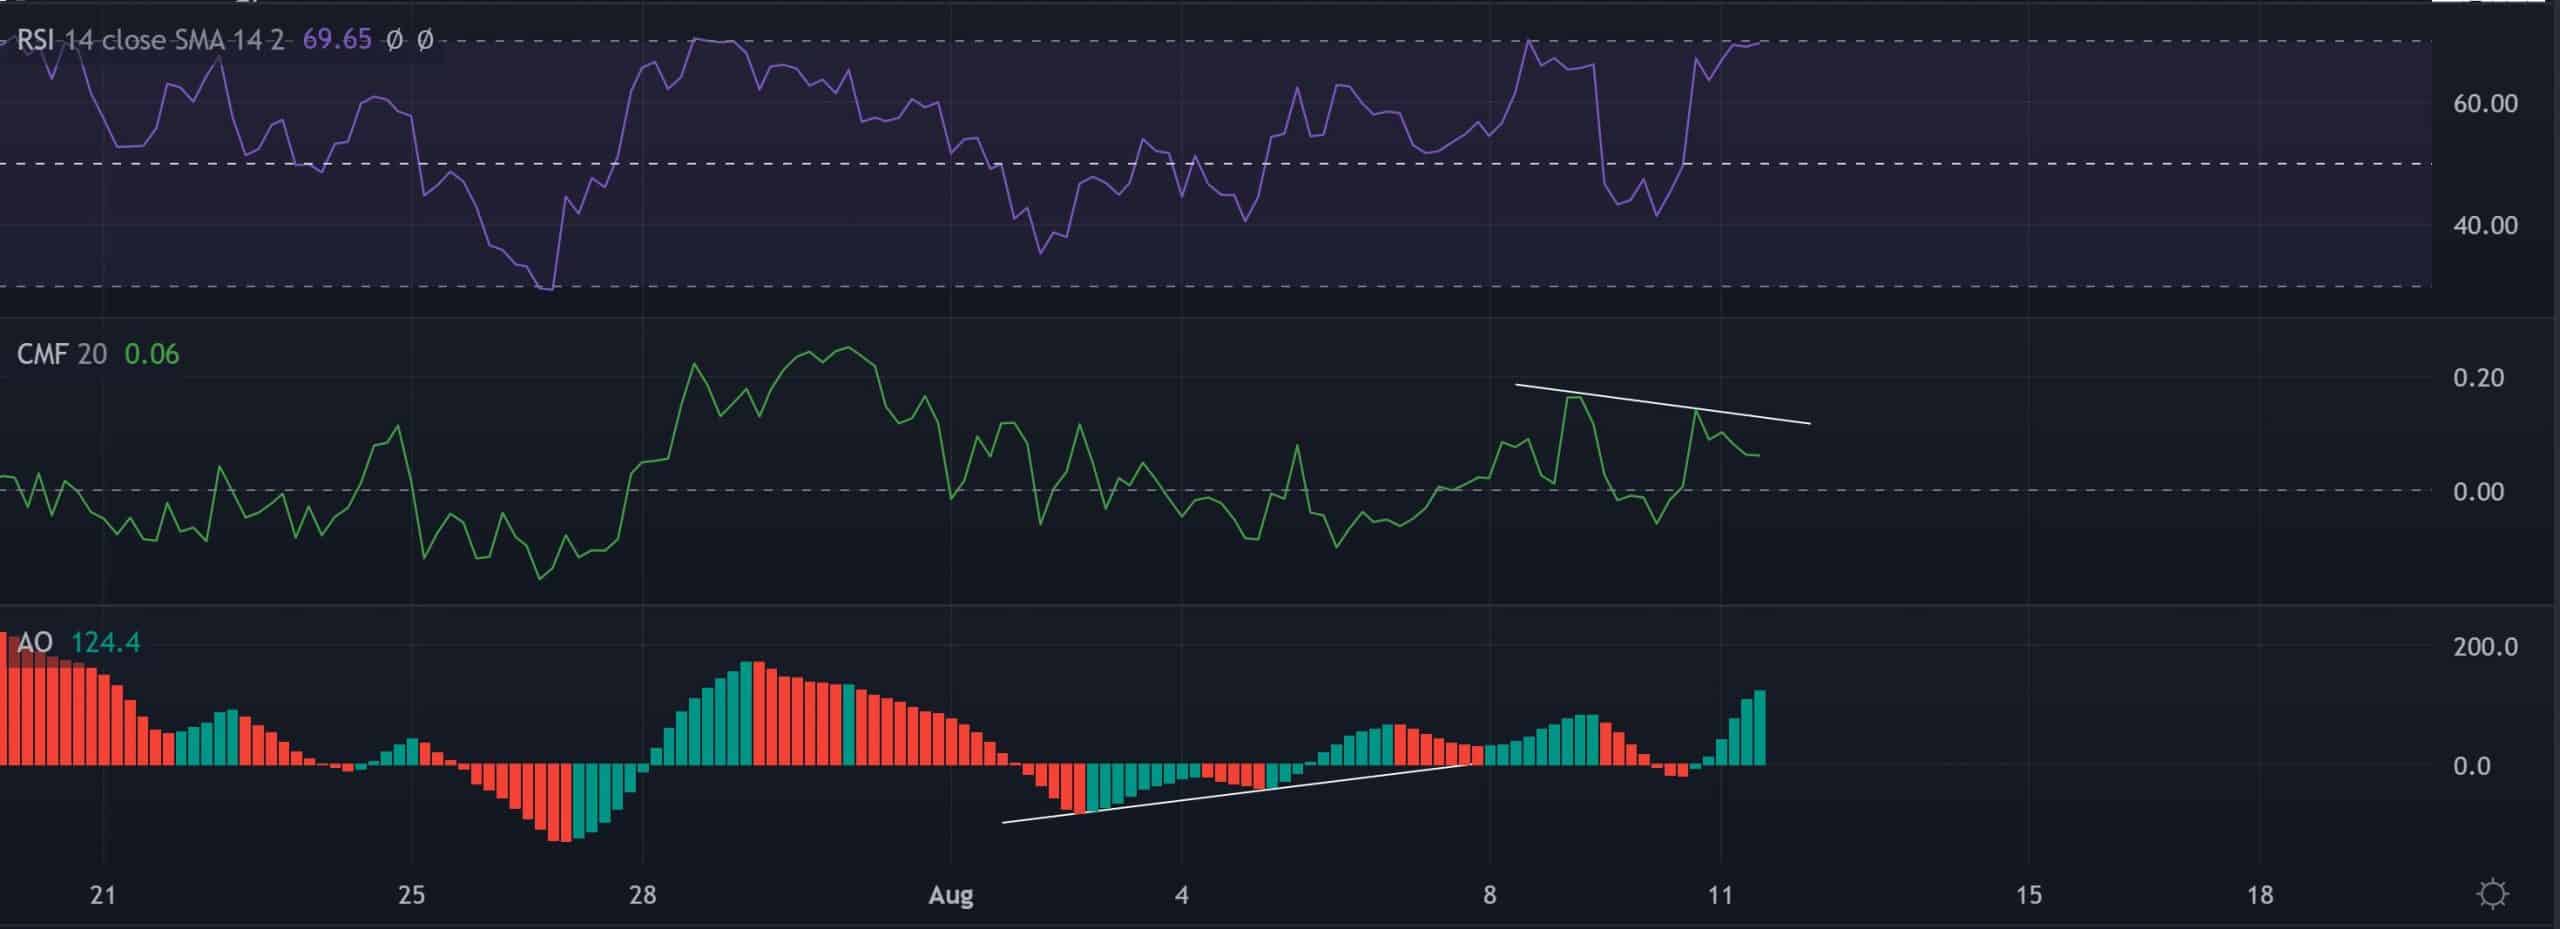
The Relative Strength Index (RSI) moved along the threshold of the overbought position at press time. Any reversal from this level can hint at near-term ease in buying power.
To top this off, the Chaikin Money Flow (CMF) marked lower peaks during the recent gains and marked a bearish divergence with price. Nevertheless, the AO lines depicted a strong buying momentum, especially after the recent bullish twin peak setup.
Conclusion
Owing to the confluence of the horizontal and trendline resistance in the $1,900 zone, ETH could see a near-term setback before picking itself up again. A close above this zone could confirm the upside trigger. The targets would remain the same as discussed above.
Finally, investors/traders need to watch out for Bitcoin’s [BTC] movement. This is because ETH shares a staggering 95% 30-day correlation with the king coin.


![Rising bond yields put Bitcoin [BTC] at risk — a Fed rate hike could be next](https://ambcrypto.com/wp-content/uploads/2026/08/IMG_4752-e1785656382502.webp)