Ethereum [ETH] Price Analysis: 21 October
![Ethereum [ETH] Price Analysis: 21 October](https://ambcrypto.com/wp-content/uploads/2022/10/Untitled-design-33.png.webp)
Disclaimer: The findings of the following analysis are the sole opinions of the writer and should not be considered investment advice.
- Ethereum’s breakdown on the weekly chart made way for a rebounding opportunity.
- The king alt’s network growth marked a significant plunge.
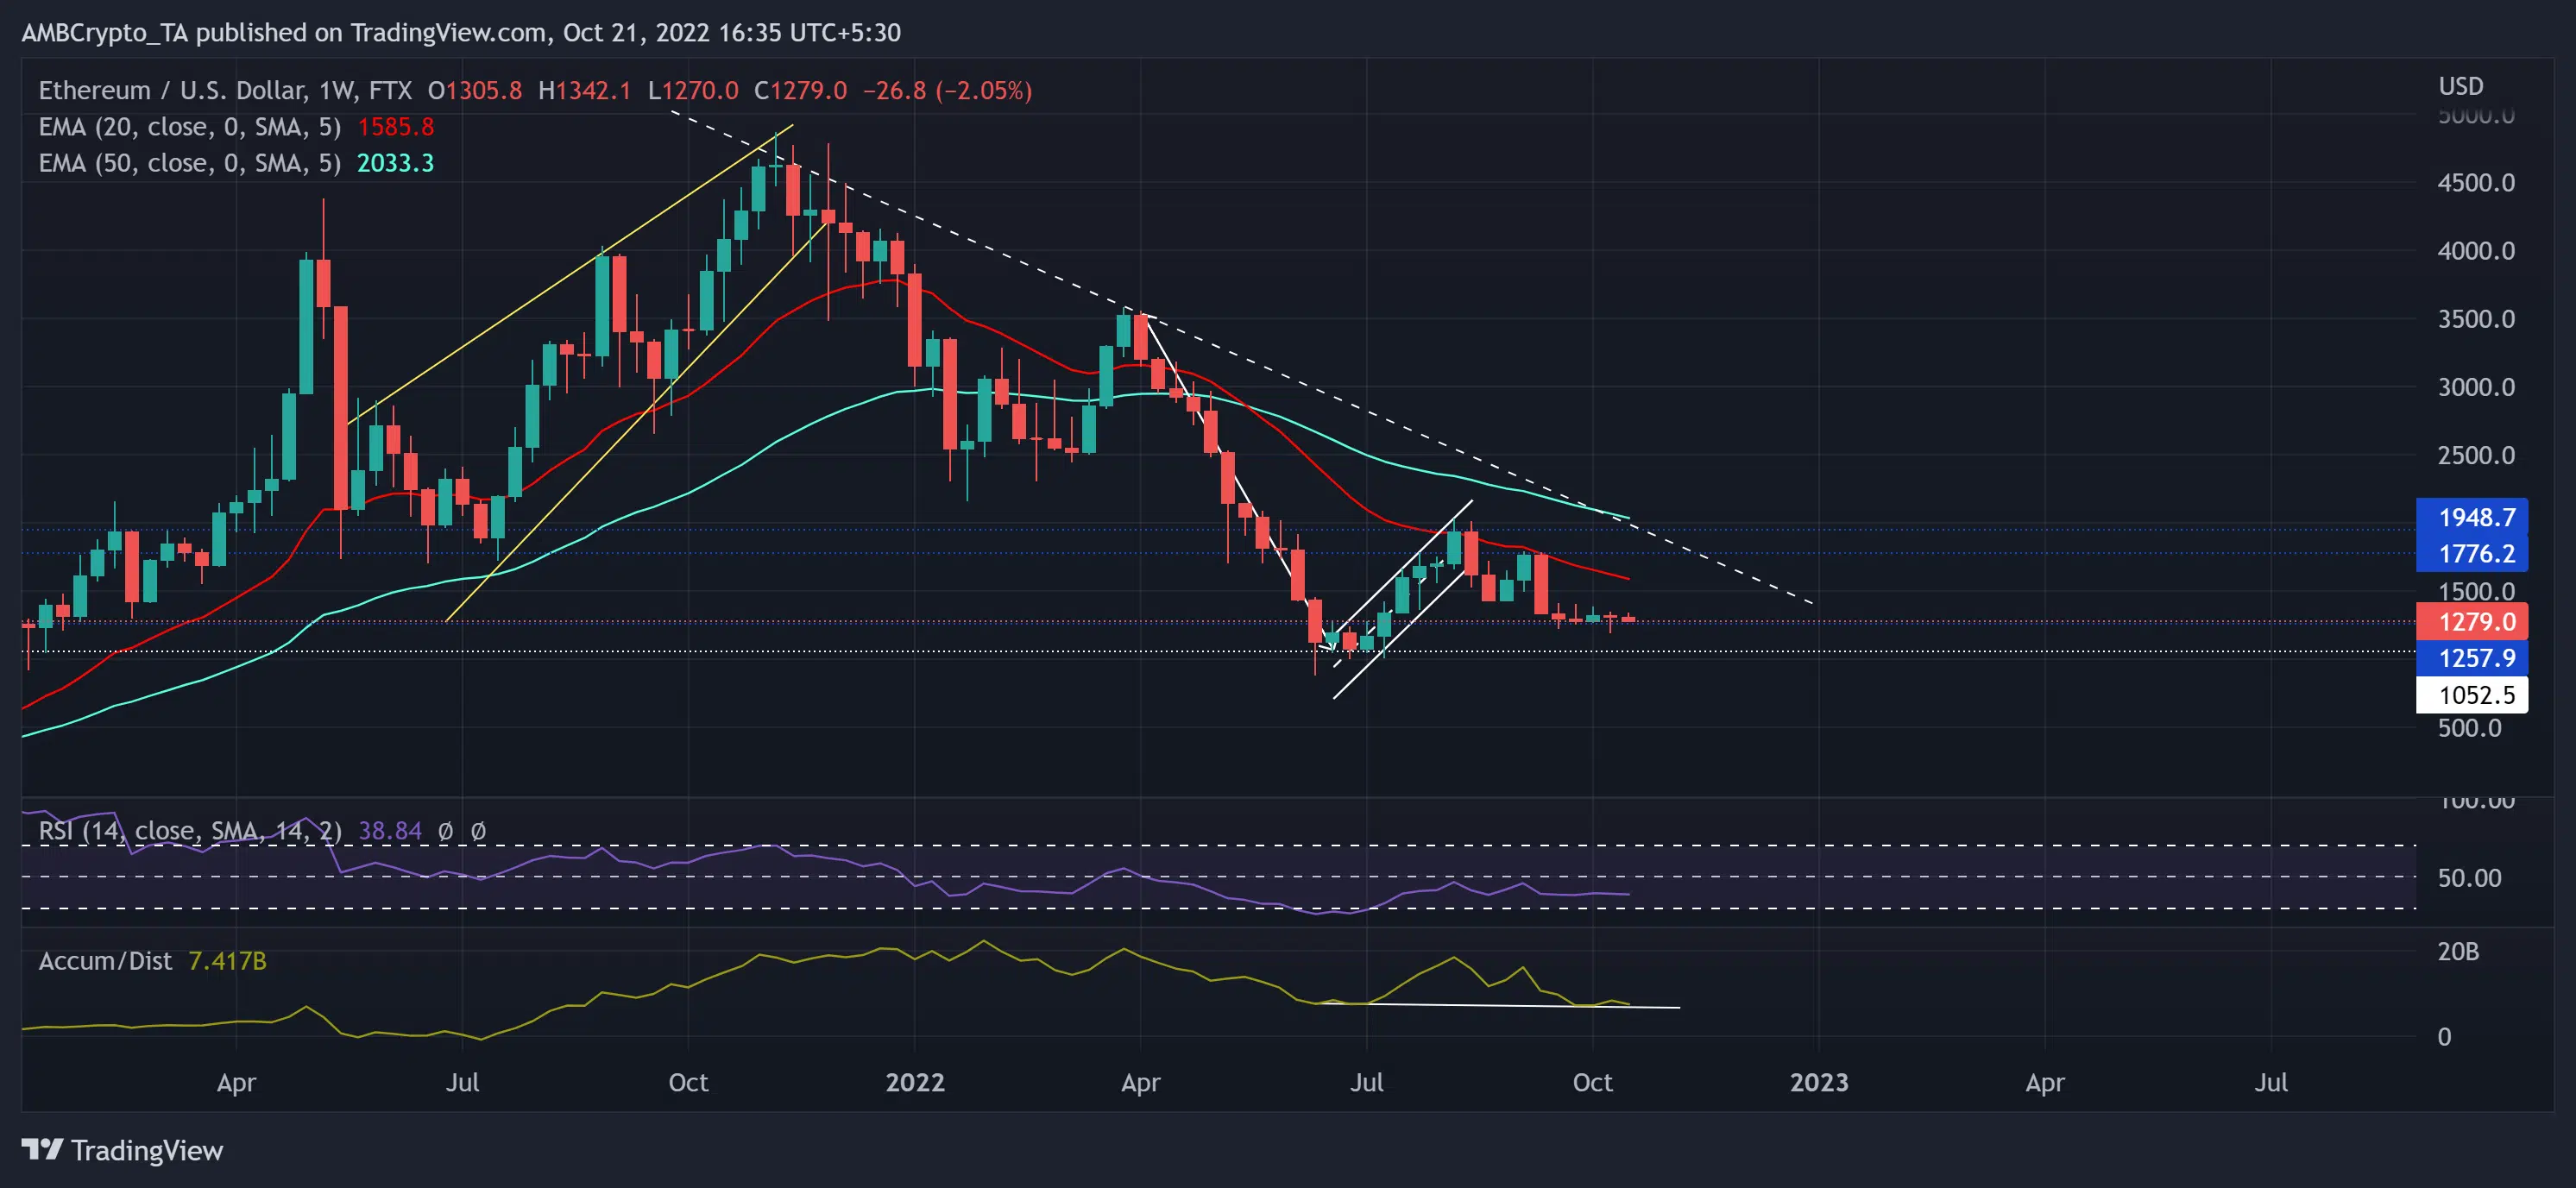
At press time, Ethereum [ETH] was down by over 70% since its ATH in November 2021. The over-extended bearish phase has kept ETH under the limitations of the weekly 20/50 EMA.
Here’s AMBCrypto’s price prediction for Ethereum [ETH] for 2023-24
Should the $1,257 support stand sturdy, it could pave a pathway for a potential recovery in the coming sessions, especially if the patterned breakdown finds a reversal. At press time, ETH was trading at $1,279.
ETH witnessed a bearish flag breakout, is a revival due?
The ongoing bear run’s steepness highlighted a one-sided bearish edge for over 11 months. The previous rising wedge’s (yellow) apex marked the king alt’s ATH. A subsequent breakdown positioned the coin for the extended pulldown.
The 11-month trendline resistance (white, dashed) subsequently constrained all the buying rallies. The reversal in April from this resistance reinforced the selling edge as it induced a bearish crossover on the 20/50 EMA.
The rebound from the $1,052 support took shape of an ascending channel (white). The 20 EMA then inflicted a reversal that set the scene for a breakdown from the up-channel.
Since then, the buyers found resting grounds in the 1,257 zone. A robust rebound above this baseline could help the altcoin to test the 20 EMA near the $1,585 level in the coming weeks/months.
To open up possibilities of a volatile bullish break, ETH buyers must protect the immediate support zone. Any decline below the $1,257 level would position the altcoin for an extended downside. In these circumstances, the first major support level would be in the $1,052 zone.
The Relative Strength Index (RSI) took a sideways track while exhibiting an edge for the sellers. Nonetheless, if the Accumulation/ Distribution (A/D) bounces back from its immediate trendline support, ETH could enter a near-term accumulation phase.
A substantial plunge in Network Growth
Since May last year, ETH’s network growth marked a consistent plunge. In particular, over the last two weeks, it plunged down to match its 2017 lows. Should the price action follow, the long-term direction would exhibit a bearish inclination.
Nonetheless, the network’s development activity has been relatively high over the past few months.
Finally, investors/traders must watch out for Bitcoin’s [BTC] movement. This is because ETH shared an 82% 30-day correlation with the king coin.


