Ethereum [ETH]: Why this pro-ETH metric needs a closer look

The bear market appears to be in full swing, despite a few stray spikes in the prices of some crypto-assets. In fact, the general sentiment towards Ethereum [ETH] seemed to be one of fear, as per the Ethereum Fear and Greed Index at press time.
The surge in fear, however, is the result of ETH’s price drop. Even so, despite the aforementioned dip, some top exchange and non-exchange addresses held over $32 million worth of ETH, according to Santiment.
This figure stood to be double than what was held by these addresses four years ago.
ETH: A work-in-progress
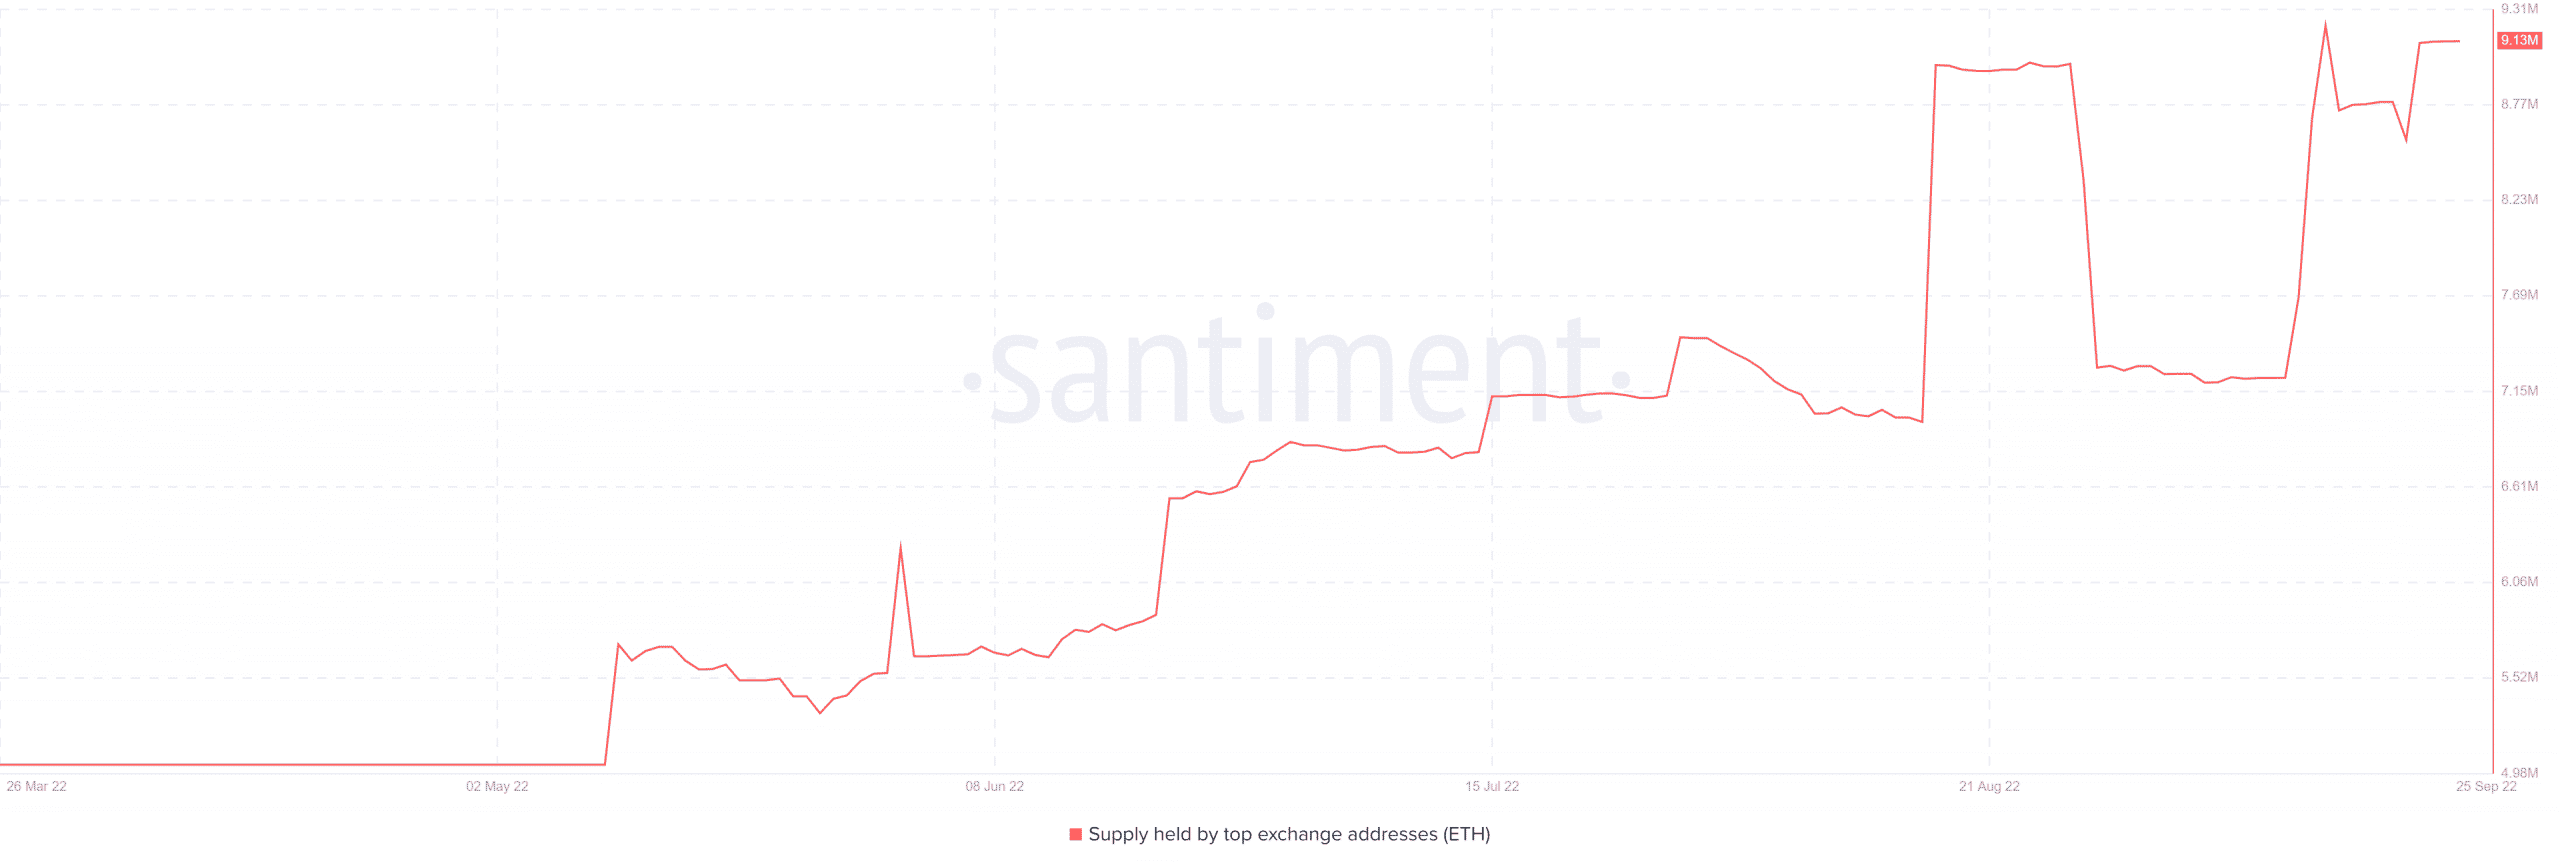
Taking a closer look at the metrics, it can be observed that the holdings of top exchange addresses rose from around $4 million in March 2022 to $9.13 million in September 2022.
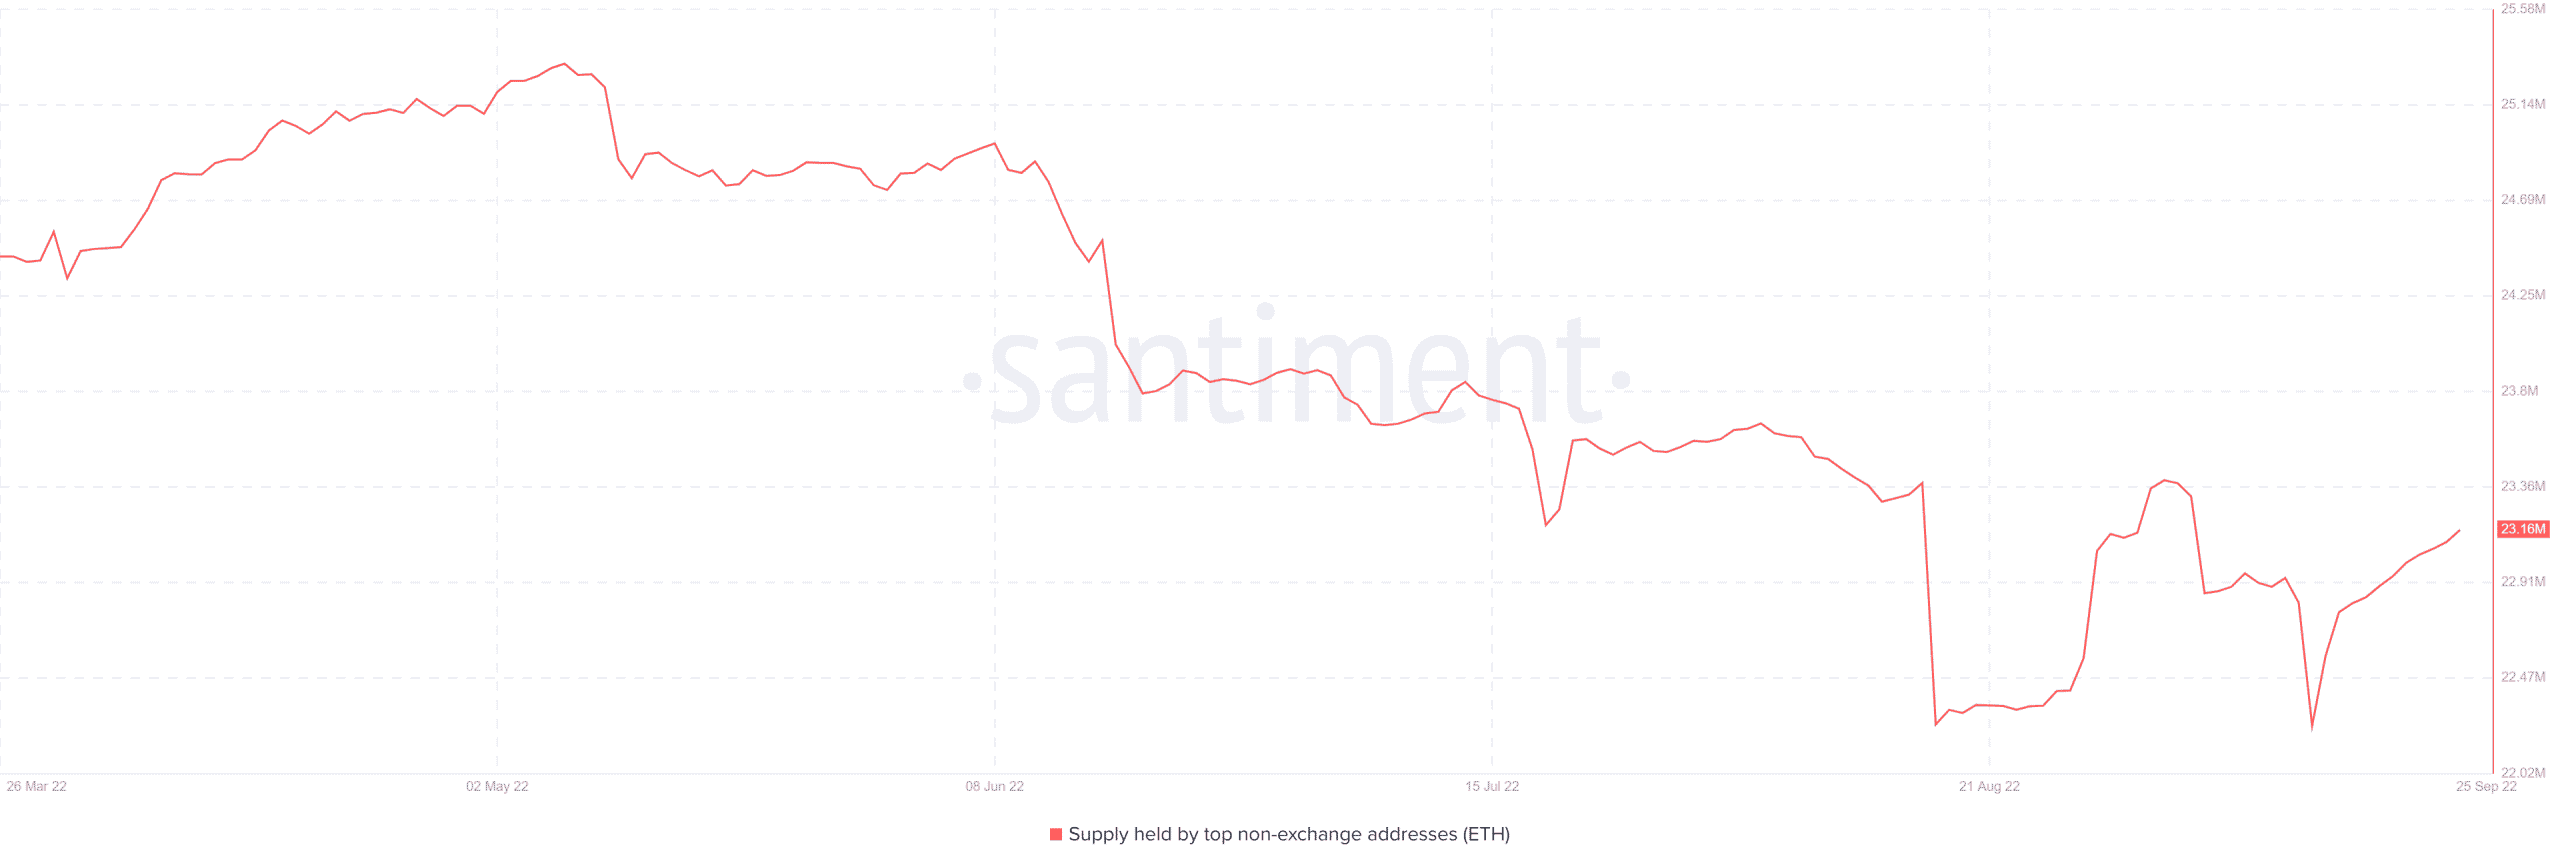
Holdings for non-exchange addresses have, however, been on a decline, though still higher when compared to exchange addresses.
Non-exchange holdings stood at $23.16 million, which brought the total holdings of non-exchange and exchange addresses to $32.29 million at press time.
Ethereum’s market capitalization stood at over $160 billion, at press time, representing over 17% of the total crypto-market.
A look at the dev activity metric also revealed that after a slight drop, the same for Ethereum was on an uptrend on the charts.
Some price moves on the cards?
An observation of the daily timeframe showed that Ethereum’s price action has been moving sideways lately. Upon plotting trend lines, it was also observed that ETH appeared to be forming a new resistance on the charts.
The resistance level was at around $1,425.6, with ETH struggling to break through the same since 19 September. A further observation of the trend lines suggested that the press time resistance acted as support until it flipped.
In fact, the press time support line seemed to be forming at around $1,210.63.
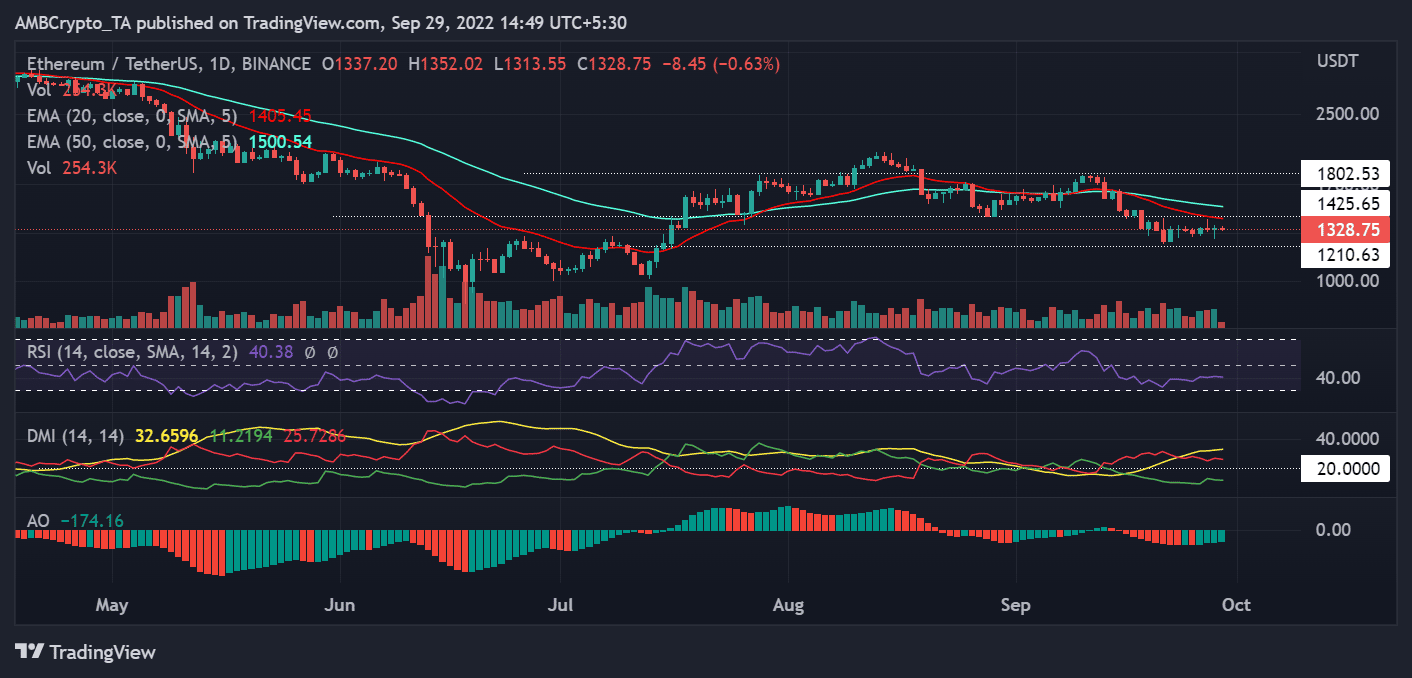
The Relative Strength Index (RSI) was visible below the neutral line too. This indicated a fairly strong bear trend. The Directional Movement Index (DMI) also showed the minus DI and the signal line over 20 confirming the bear move of the asset.
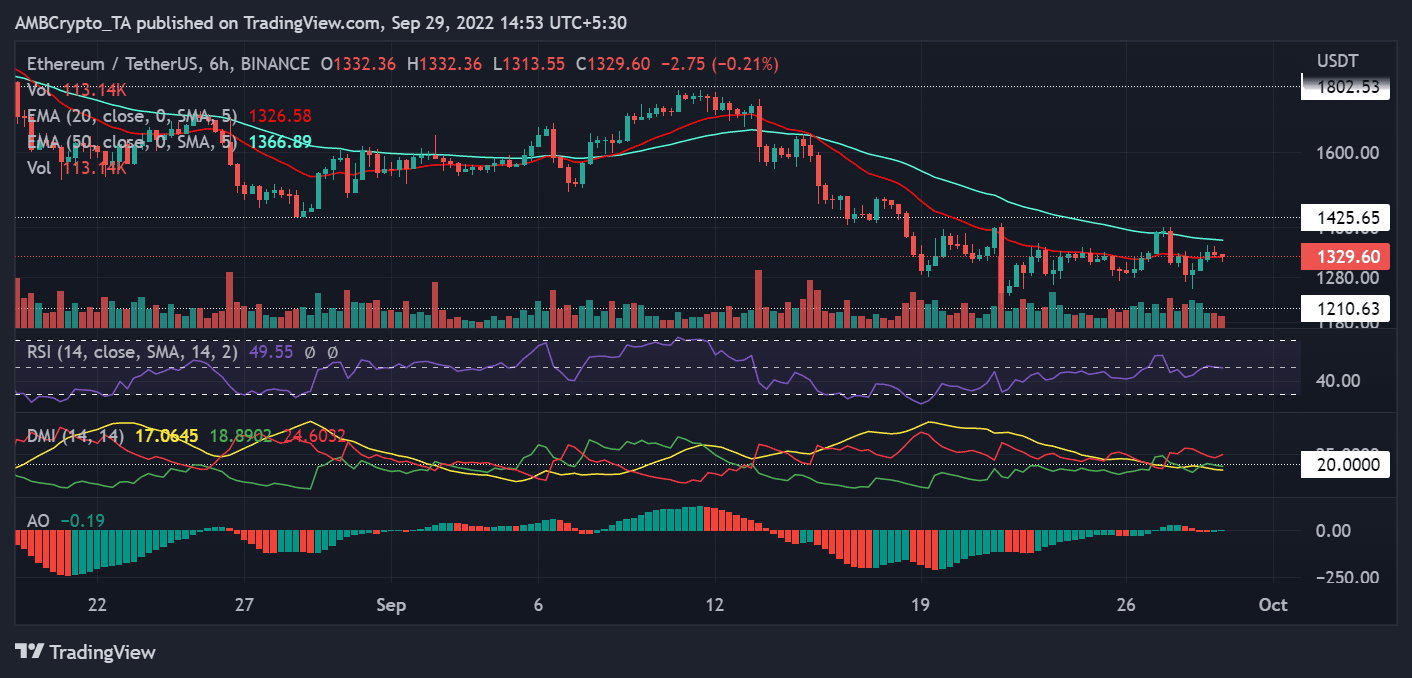
The RSI and the DMI on the 6-hour time frame showed the bear trend weakening. The six-hour frame also underlined the RSI creeping on the neutral line, while the signal and plus DI line stood close to 20 on DMI.
If the price is able to break beyond its press time resistance, it might see a move to its previous resistance level of $1,800.
Finally, the current circulating supply of Ethereum is over 120 million. The holdings of top addresses would only account for over 20,000 of the total circulating supply, if recent calculations are to be believed.
What this means is that the movement of these holders cannot greatly impact Ethereum’s price action.


