
Ethereum was a stone’s throw away from rising above a key resistance channel between $2,900-3,000. Ethereum Classic moved sideways and awaited stronger cues before making a price swing. Finally, Polkadot moved within an up channel but gains were expected to be limited at $30-resistance.
Ethereum [ETH]
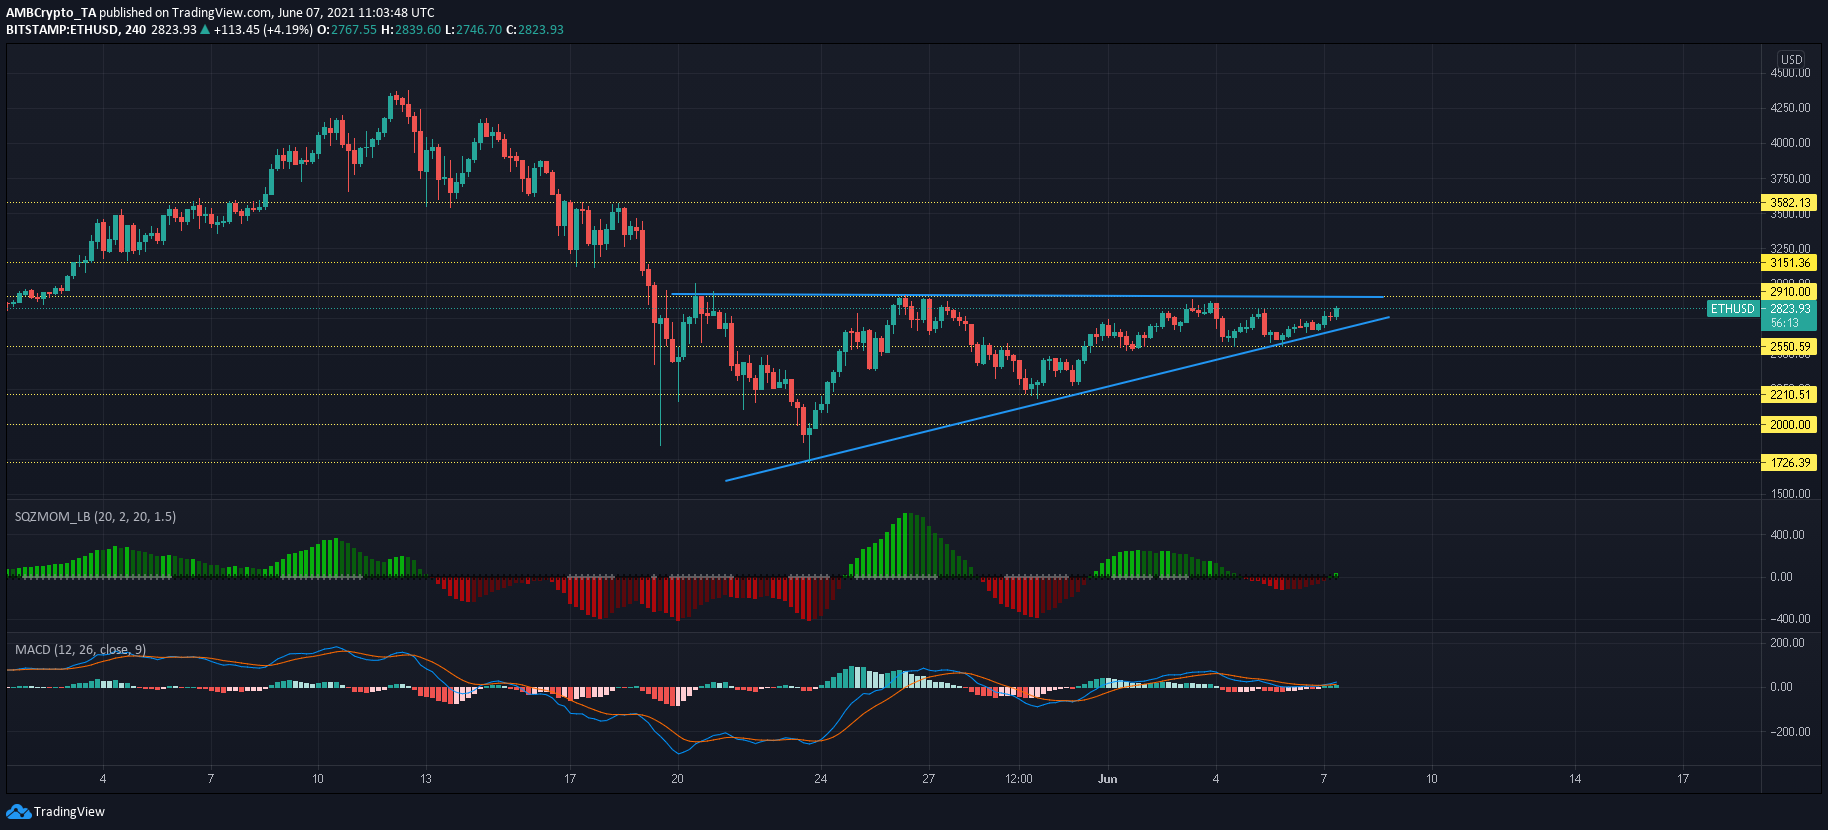
Source: ETH/USD, TradingView
Ethereum eyed an important development over the next few sessions. Trading around $2,800, its price was just 3% away from $2,900-3,000 resistance. A successful breakout might be able to push the world’s largest altcoin towards $3,500- a development that would likely boost the global cryptocurrency market as well.
According to Squeeze Momentum Indicator, bearish momentum has been declining over the past few sessions but volatility remained low. A series of white dots and rising green bars would back a breakout prediction. If sellers manage to deny ETH yet again, the cryptocurrency could find support around the $2,700-mark. MACD line maintained above the Signal line but a bearish crossover could deny a favorable outcome.
Ethereum Classic [ETC]
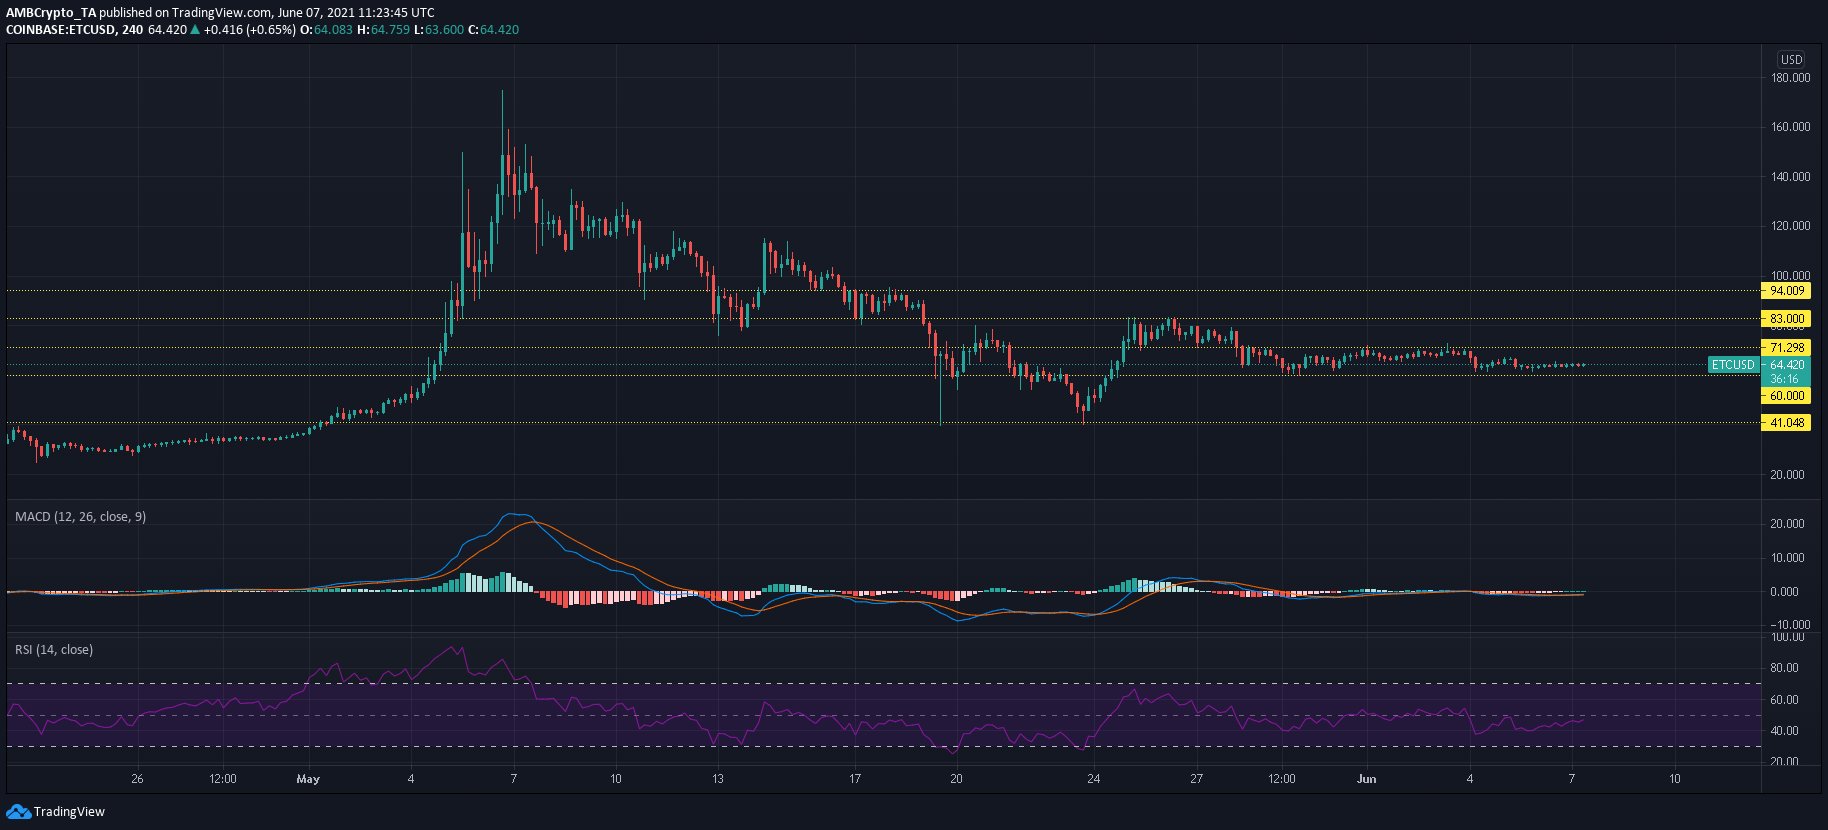
Source: ETC/USD, TradingView
As Ethereum prepared for taking on sellers at $3,000, Ethereum Classic remained constricted within its channel of $71.3 and $60, seemingly unaffected by bullish sentiment. This channel would most likely be maintained if ETH fails to breach its upper ceiling. A successful breakout, however, may induce some buying in the ETC market as well. Such an outcome could trigger a 26% rally towards $83.
At the time of writing, ETC reflected a balanced market. MACD line was superimposed on the Signal line, while RSI drifted in neutral territory over the past few sessions.
Polkadot [DOT]
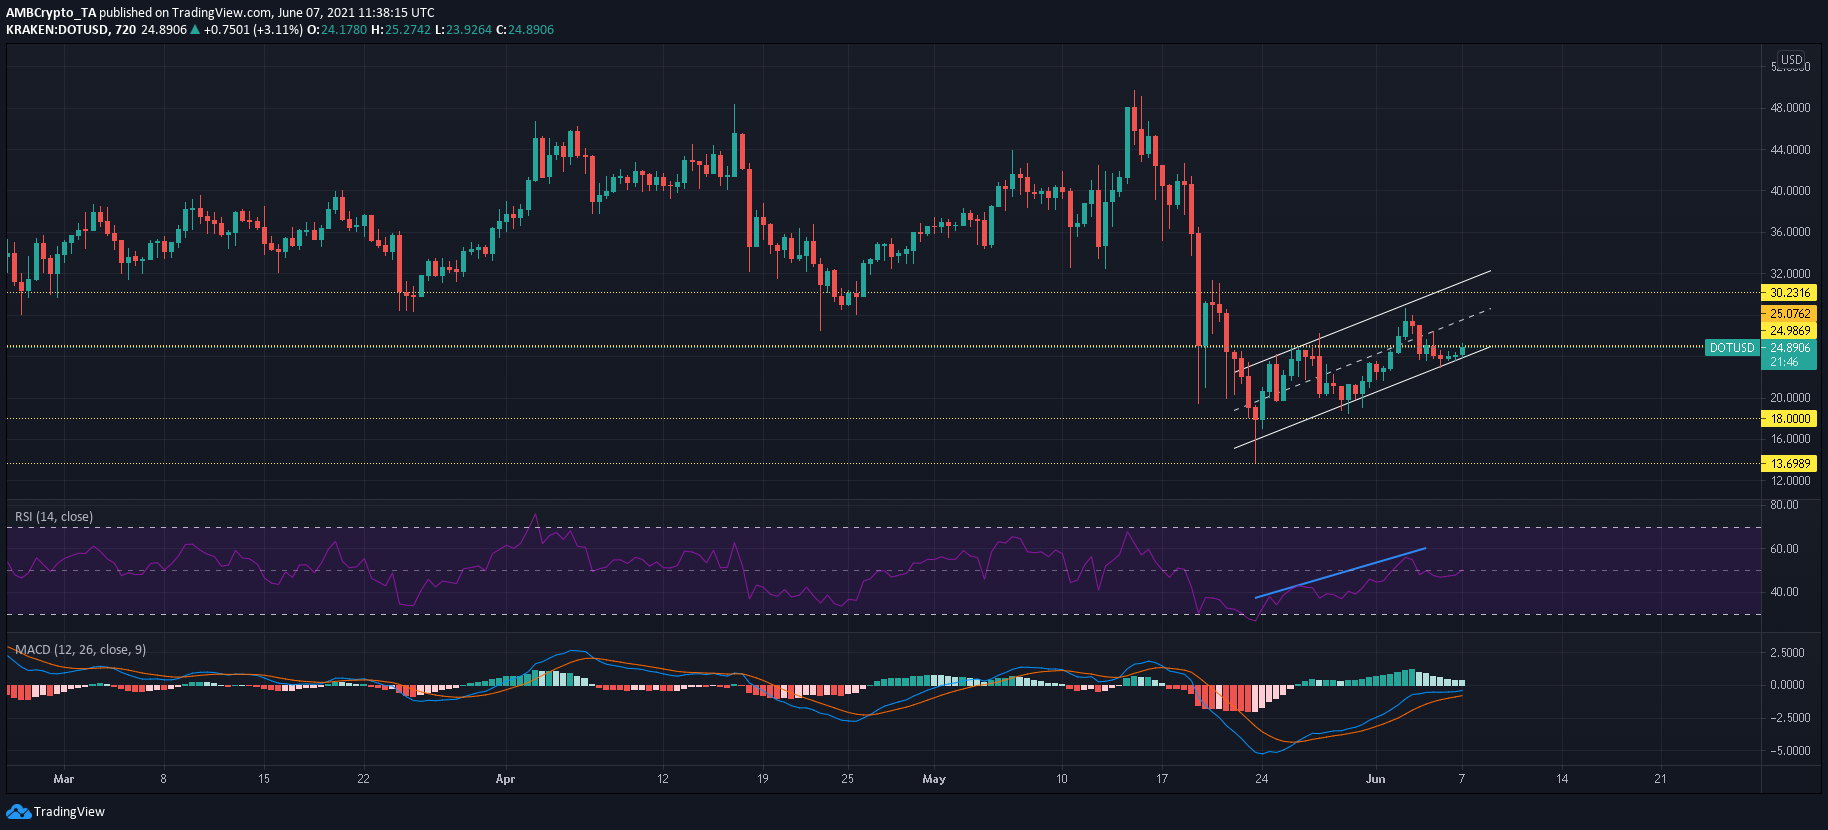
Source: DOT/USD, TradingView
Polkadot’s traded within an up-channel and defended the bottom trendline from an early breakdown. However, MACD’s histogram showed that bullish momentum has been declining over the past few days as Signal line caught up to the fast-moving line. If buying pressure evaporates and sellers take over, DOT could move south from its channel and towards $18-19 support. Another option was a movement within the channel, but $30-resistance would likely counteract any attempts at a further spike.
RSI was making higher highs but the same could reverse once DOT touches the upper resistance mark at $30.


