Ethereum, Fantom, Axie Infinity Price Analysis: 07 February

After hitting multimonth lows on 24 January, the bulls stepped in to stall the substantial sell-offs and reversed the near-term trajectory of most altcoins.
Ether’s near-term 4-hour SMA rose above its long-term SMAs, revealing a bullish edge, but it still struggled to gather enough volumes. Also, Fantom and Axie Infinity saw an overbought RSI due to double-digit 24-hour gains after a patterned breakout.
Ether (ETH)
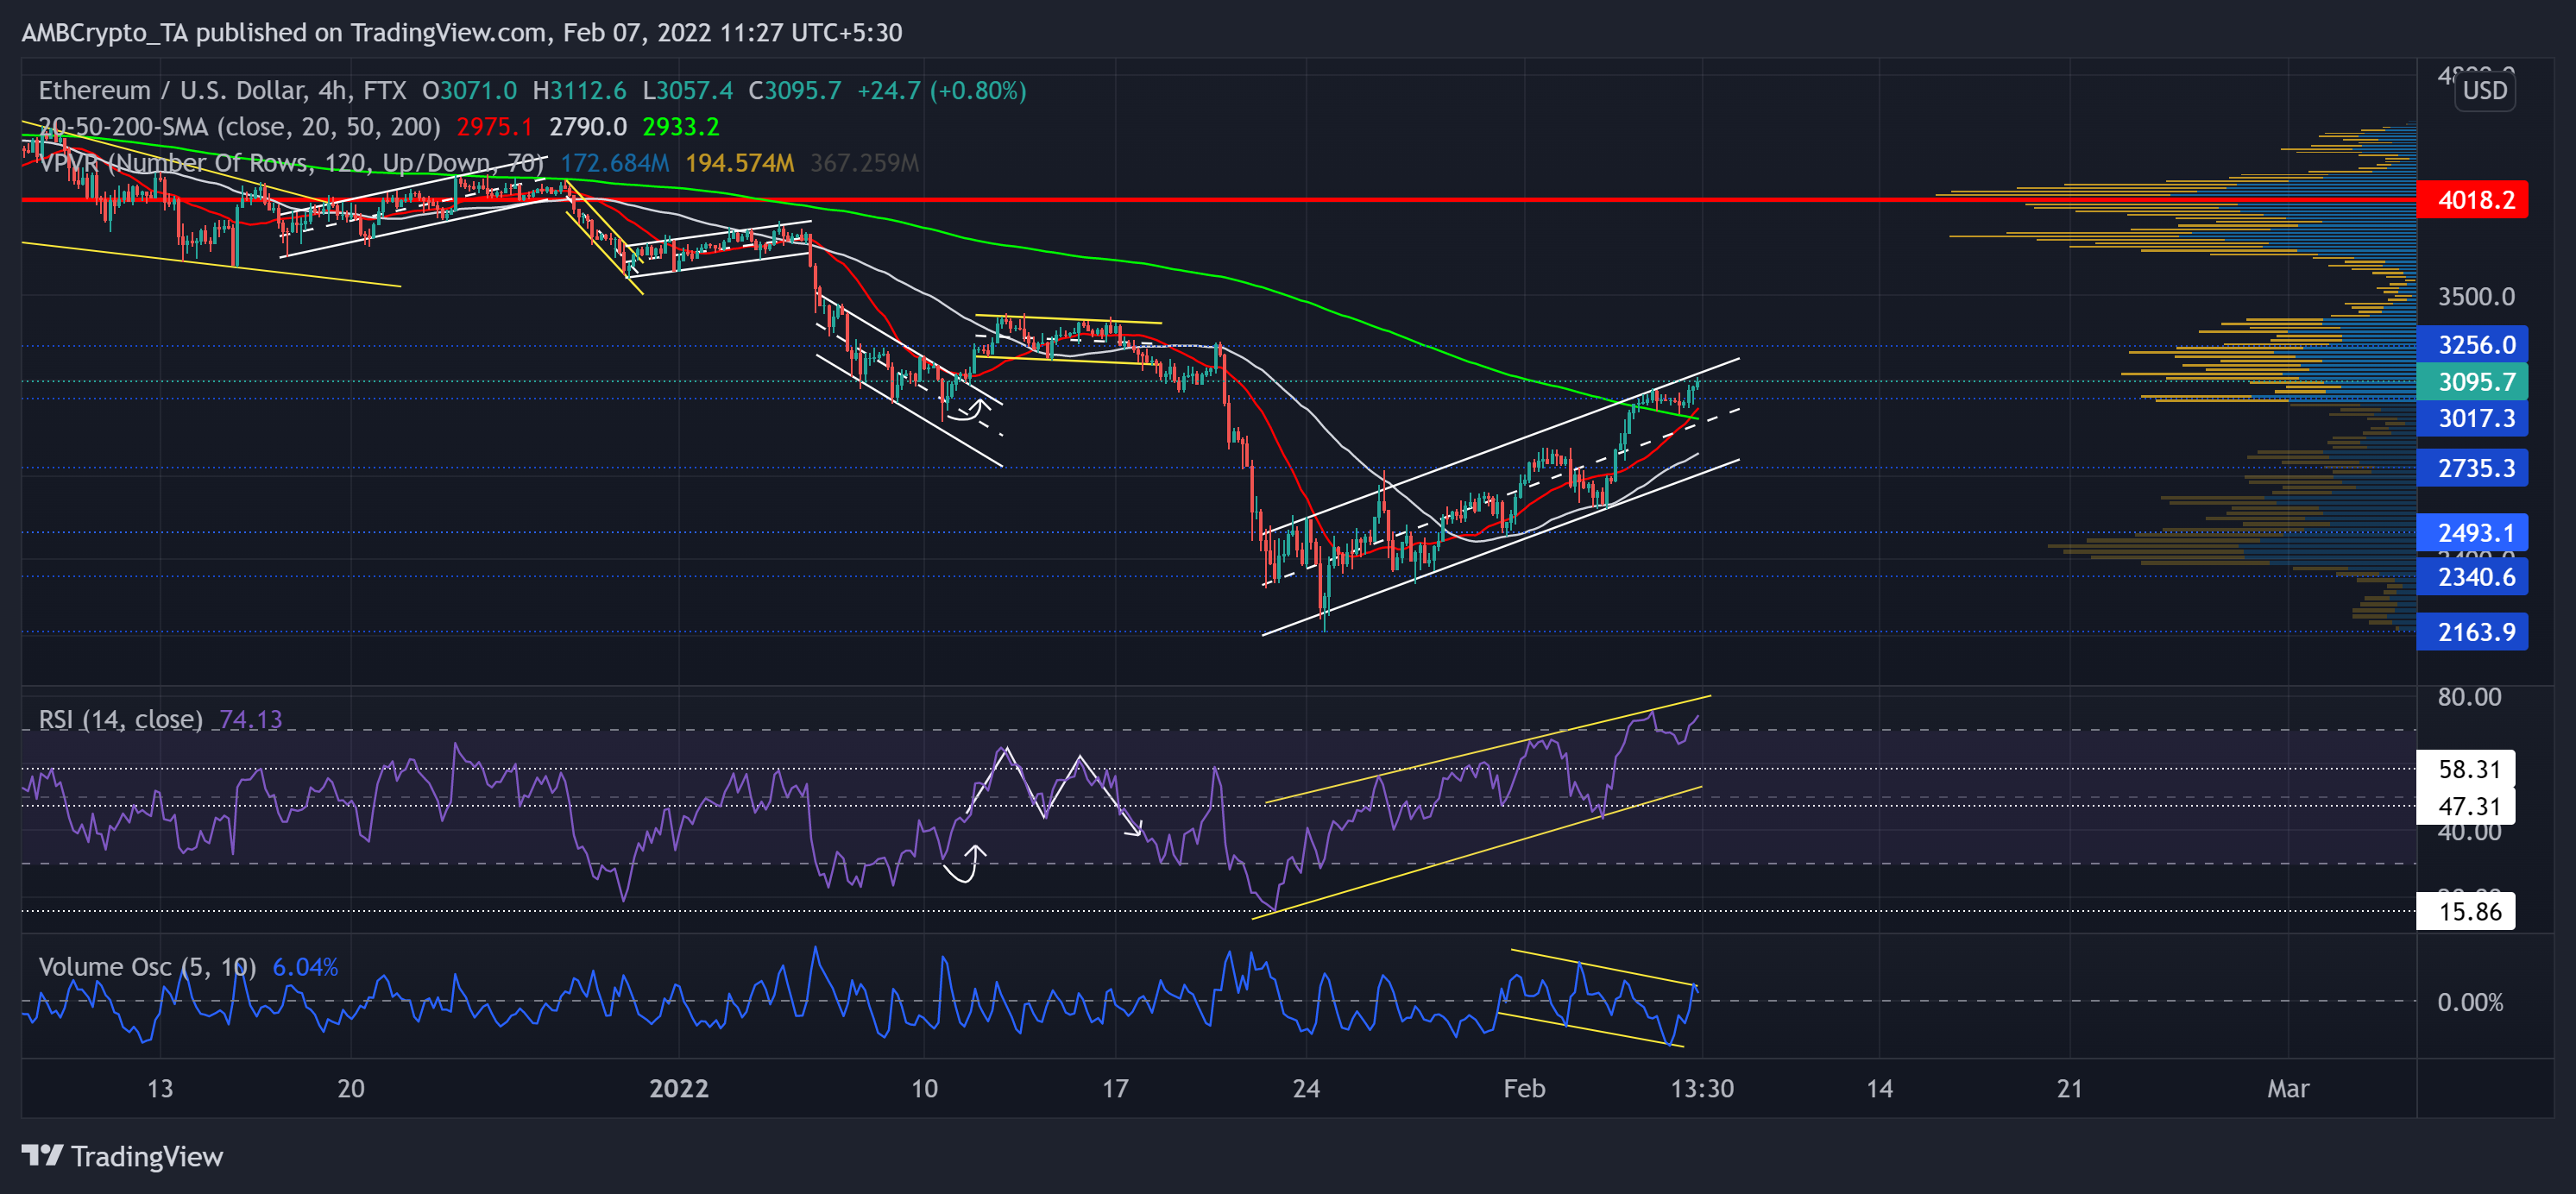
Since falling below its Point of Control (red) at the $4,000-mark, ETH bears initiated substantial sell-offs. As a result, ETH registered a 46.81% loss (from 27 December high) and touched its six-month low on 24 January.
Since then, however, it saw a staggering 43.5% ROI in just the last 13 days while piercing through multiple ceilings. As a result, the king alt marked an ascending channel (white) and reclaimed the $3000-support. Further, the 20 SMA (red) crossed the 50/200 SMA, hinting at the heightened bullish edge. Immediate resistance stood at the upper trendline of the channel.
At press time, ETH traded at $3,095.7. The RSI saw a solid recovery from its 47-mark support. It revived by over 30 points in the last four days while testing the overbought region. Besides, one must take note of the lower peaks and troughs on the volume oscillator, depicting a slightly weak bull move.
Fantom (FTM)
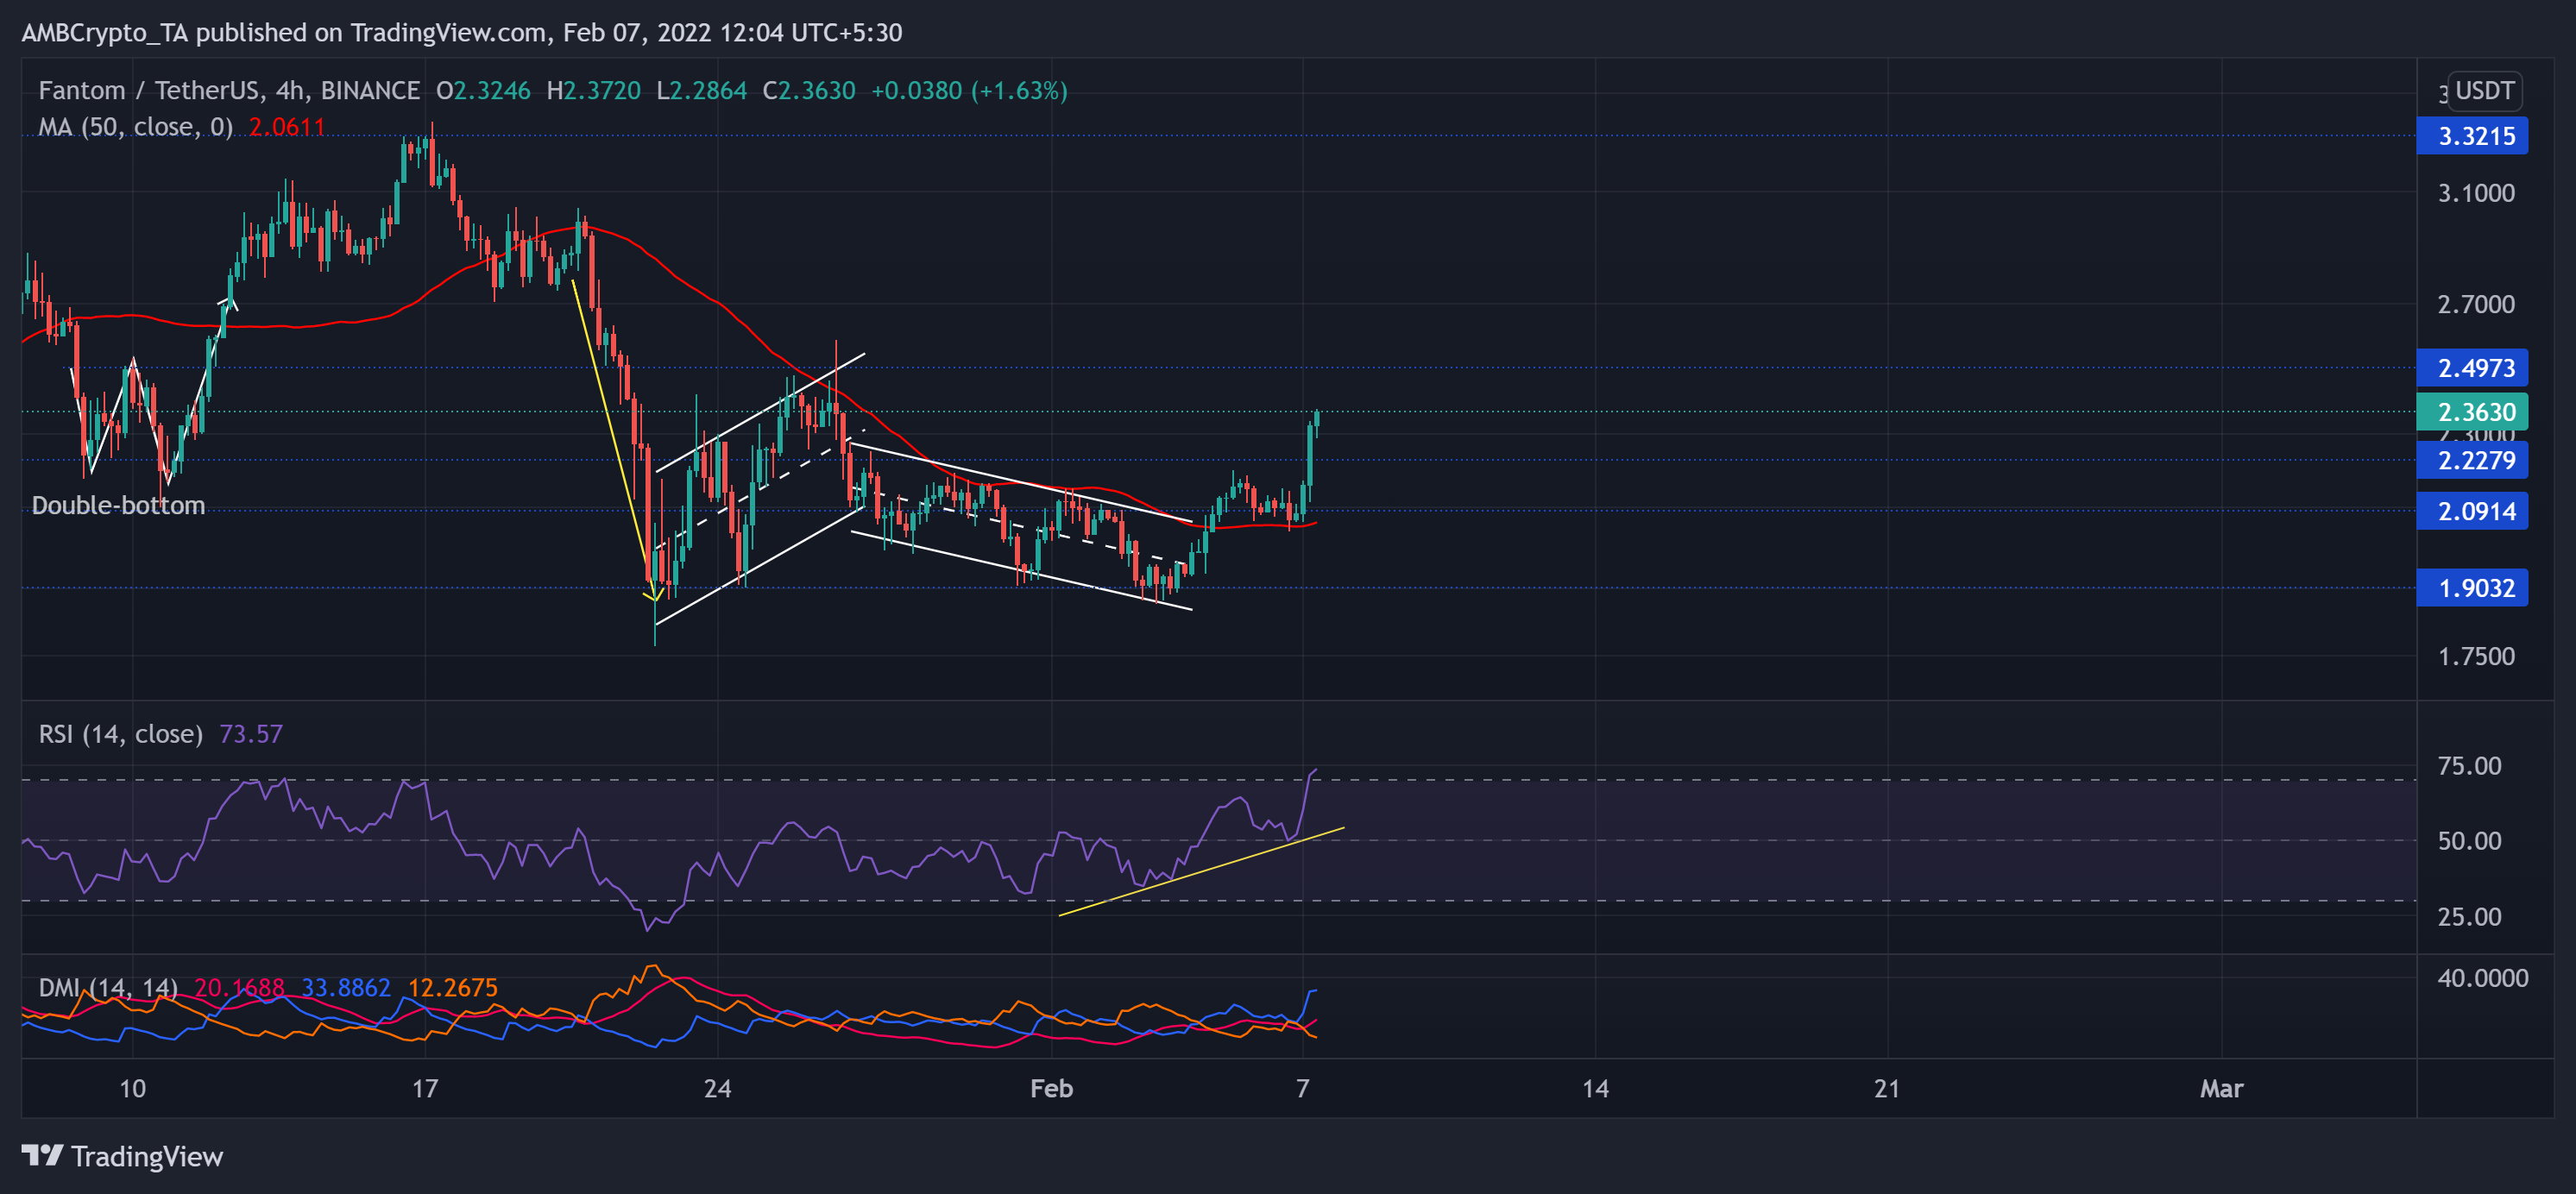
Since FTM reversed from the $3.32-level, the bears have exerted constant pressure. Consequently, it lost nearly 48.07% (from 17 January) and gravitated towards its one-month low on 24 January.
Then, the alt saw a bearish flag breakdown that tested the $1.9-mark support. But with an impressive 25.4% three-day gain, it clawed back to claim the $2.22-support. With this jump, the bulls overturned the 50 SMA (red) from its resistance to support.
At press time, FTM traded at $2.363. The RSI saw a rapid recovery from its trendline support. Now, it moved into the overbought region depicting a bullish bias. Further, the DMI skewed in favor of buyers. But the ADX (directional trend) remained weak.
Axie Infinity (AXS)

After being on a steady downtrend, AXS lost multiple resistance (previous support) levels in the last two months. The alt lost more than half of its value (since 5 January) as it rushed south to touch its five-month low on 24 January.
Since then, it found an oscillating range between the rectangle (yellow) before a substantial break out on 5 February. AXS registered a 57.01% gain (from 3 February low) while recovering the lost $65-support. The immediate resistance stood near the 61.8% Fibonacci level.
At press time, AXS traded at $70.126. The RSI saw a 44 point surge in just four days as it headed deep into the overbought mark. A potential slowdown from here would be likely in the near term.


