Ethereum

Ethereum favours the bulls but momentum remains insignificant
Posted:
| Last updated: October 5th, 2019

Ethereum was trading at $174.85 with a total market cap of over $18 billion with a downfall of 1.84% on the 24-hour price chart.

Source: CoinStats
1-hour Price chart
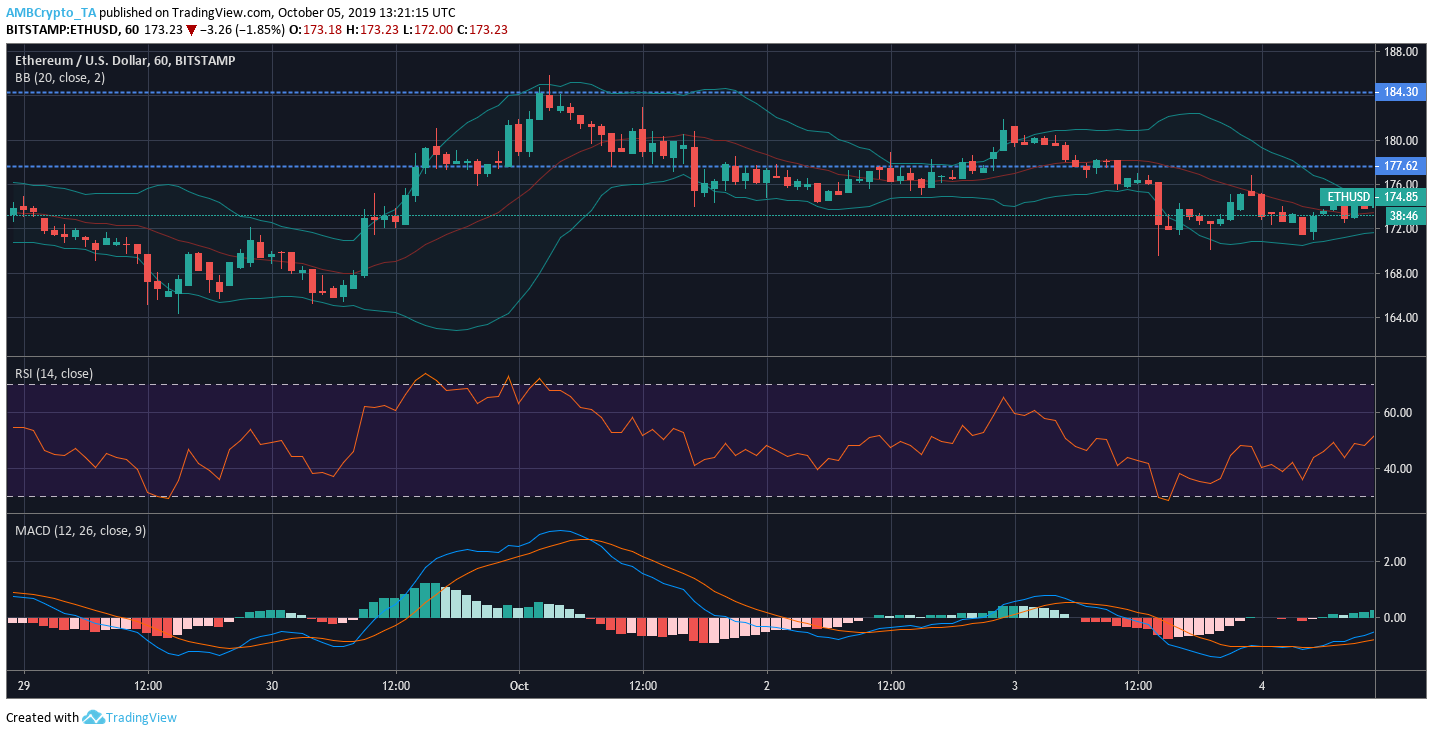
Source: ETH/USD at TradingView
Resistance 1: $184.30
Resistance 2: $177.62
The Bollinger band indicator shows low price volatility as the lines converged in the charts.
The RSI indicator indicated that the Ethereum was neutra in term of selling and buying capacity.
The MACD indicator indicated that bulls have an upper hand in the current market.
1-day price chart
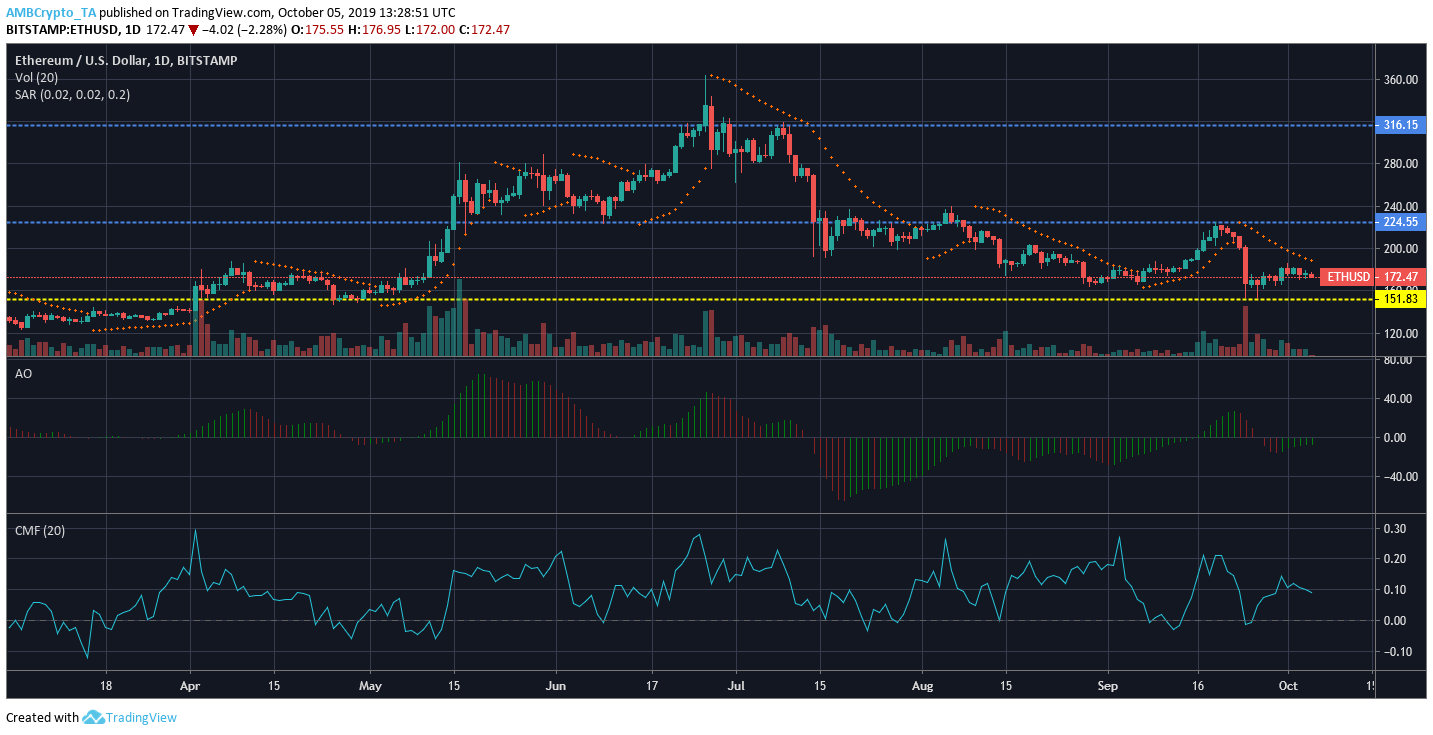
Source: ETH/USD at TradingView
Resistance 1: $316.15
Resistance 2: $224.55
Support 1: $151.83
The Parabolic SAR indicator showed that the marker is above the candles indicating a bearish trend.
The Awesome Oscillator exhibited the occurence of green bars projecting a bullish circle.
The Chaikin Money Flow or CMF indicated that capital flowing in the market was higher than capital flowing out.
Conclusion
The chart analysis of Ethereum suggested that the price has been on an uprise since the recent fall but the momentum lagged behind in terms of taking stride on another major bullish run.