Ethereum, IOTA, BitTorrent Price Analysis: 21 August

Bitcoin’s climb above $48K spurred buying in the broader market but did not lead to a blowout. Ethereum consolidated between $3290.27 and $2977.68. IOTA, on the other hand, jumped 5.1% while eyeing its next resistance at $1.11. Further, with sustained higher highs, BitTorrent could topple over the $0.0046 resistance level.
Ethereum (ETH)
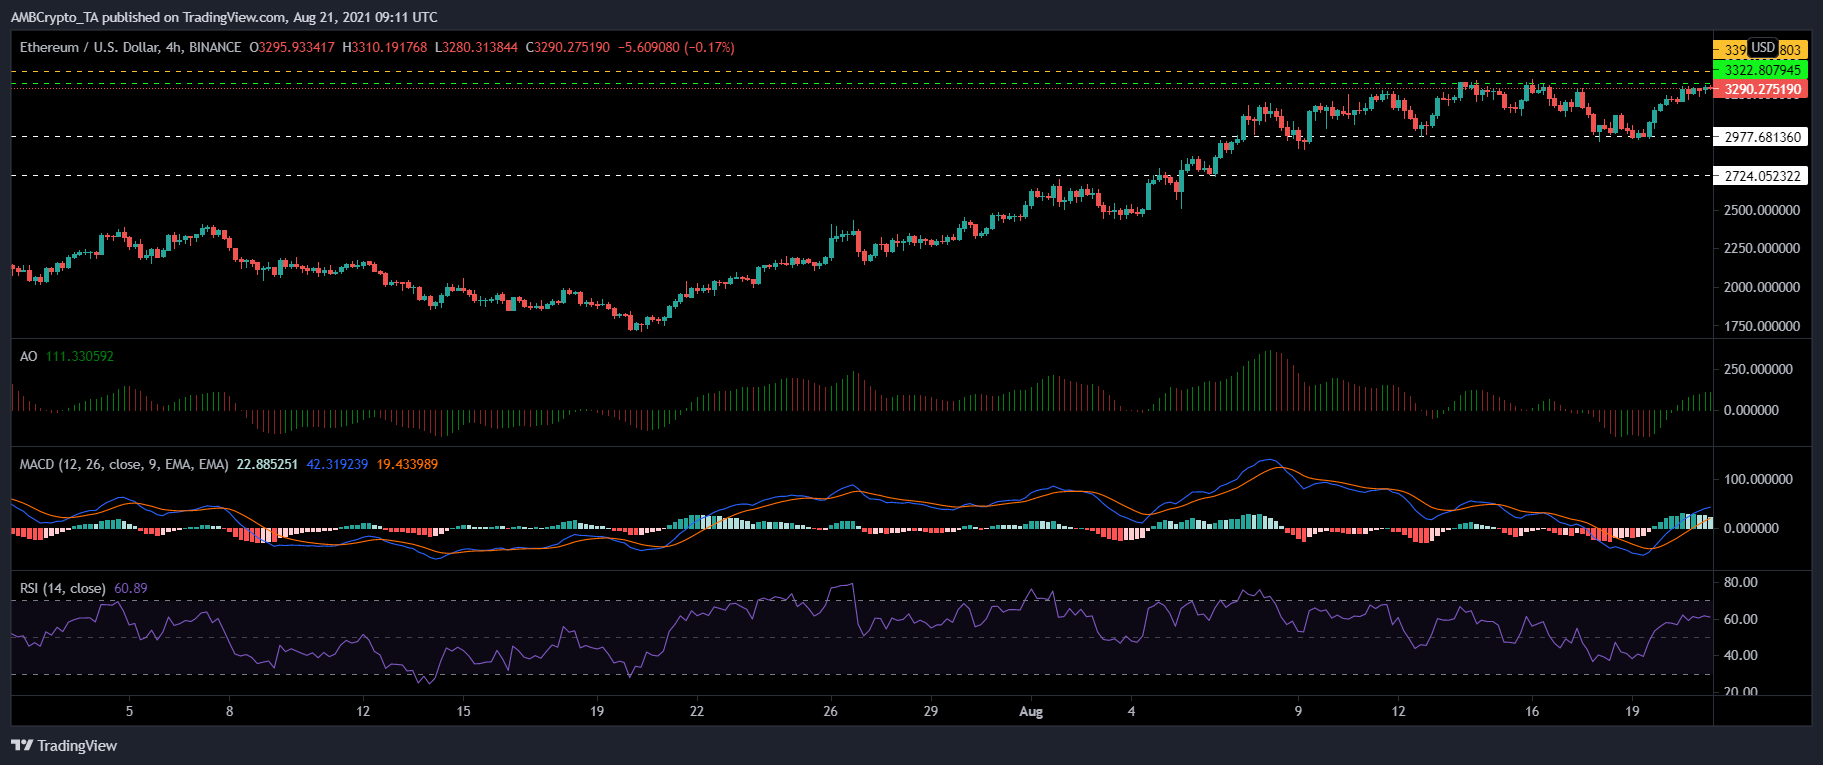
Ethereum rose 2.5% over the last 24 hours and traded at $3290.27. It steadied itself above its $2977.68 support level while flashing signs of consolidation. If prices remain around the same level over the upcoming trading sessions, ETH could break out on the upside to test $3322.80.
Technicals, however, pointed towards mixed signs on the 4-hour chart. Awesome Oscillator noted green signal bars and highlighted positive price action. Buying strength recovered from the bearish zone, as the Relative Strength Index stood near the 60-mark.
MACD also emanated bullish signals, although the green bars on its histogram were receding over the past few sessions. In the event of a price reversal, ETH could find support at $2977.68.
IOTA
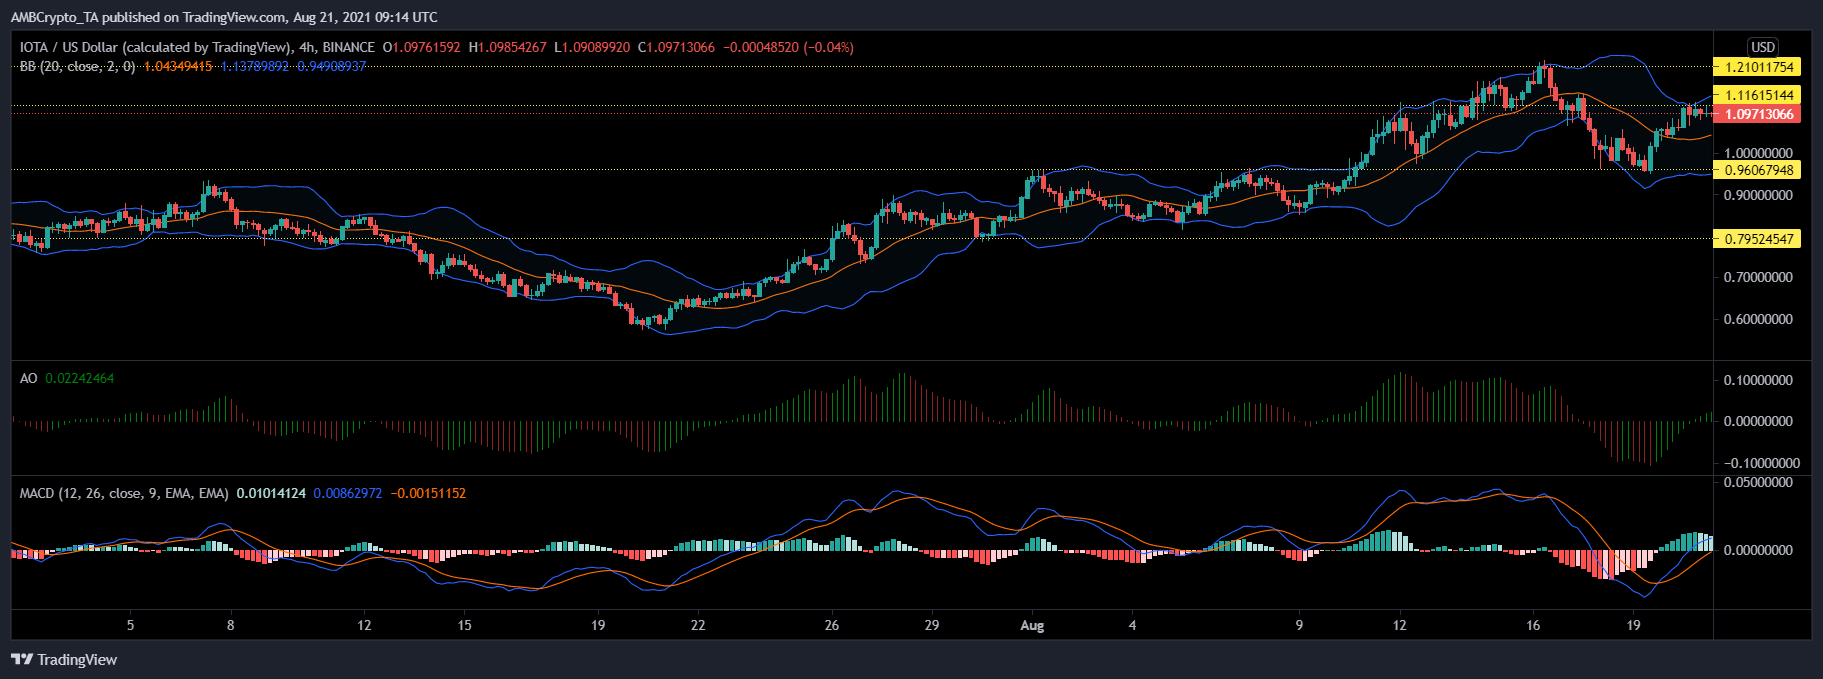
IOTA jumped 5.1% on its chart over the last day, and was priced at $1.09 at press time. The alt prepared to touch its immediate resistance of $1.11 while steering off its support level of $0.96. Technicals remained quite positive for IOTA.
In case IOTA manages to topple over the $1.11, it could aim to test the $1.21 resistance. MACD exhibited green bars on the histogram. Bollinger Bands showed divergence, which indicated probable chances of increased market volatility.
Awesome Oscillator registered green signal bars. On the flip side, IOTA’s support areas lay at $0.96 and $0.79.
BitTorrent (BTT)
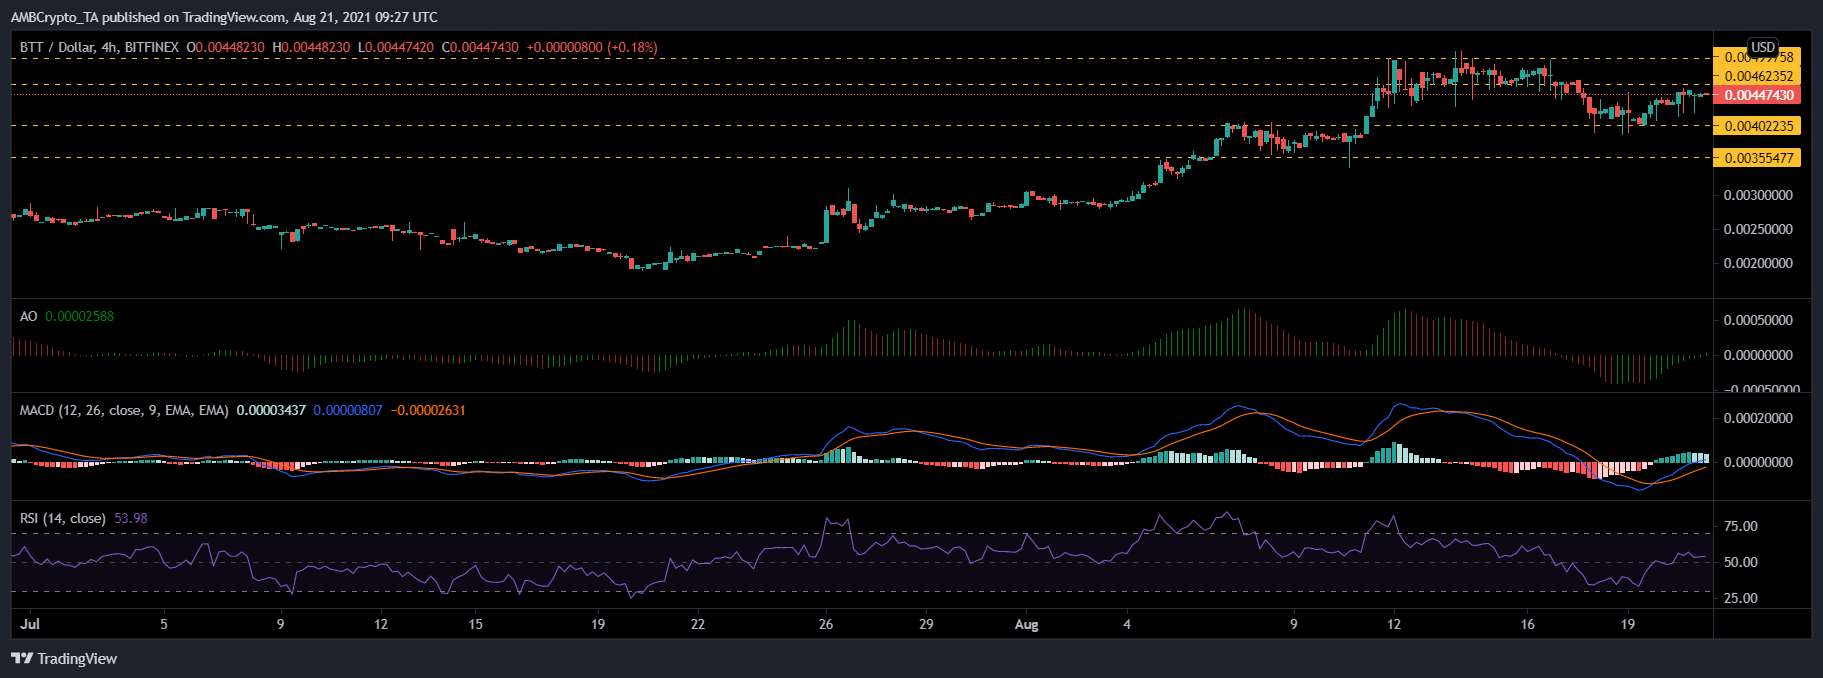
BTT rose by 2.6% in the last 24 hours. Trading at $0.0044, at press time, it was moving in a range-bound manner. If it continues to form higher highs, it could soon topple over the $0.0046 and $0.0049 resistance lines.
The indicators displayed mixed price movement in the market. Awesome Oscillator noted green signal bars and also flashed a buy signal for traders. Correspondingly, the Relative Strength Index moved above the half-line and stood near the 50-mark as buying pressure gained some strength.
Receding green bars were seen on the MACD histogram, as it was on a verge of undergoing a bearish crossover. If the aforementioned statement holds true, BTT could fall on the $0.0040 and $0.0035 support levels.