Ethereum long-term Price Analysis: 11 December

Disclaimer: The findings of the following article are the sole opinion of the writer and should not be taken as investment advice
The cryptocurrency market’s rally has been halted in its tracks, and most altcoins along with Bitcoin have been registering a significant drop in prices lately. Ethereum, the world’s second-largest cryptocurrency, has also been seeing its price drop along the price scale. At press time, the digital asset was being traded at $544 as it approached the support level at $507.
Here, there could be a short position the traders can take advantage of.
Ethereum one-day chart
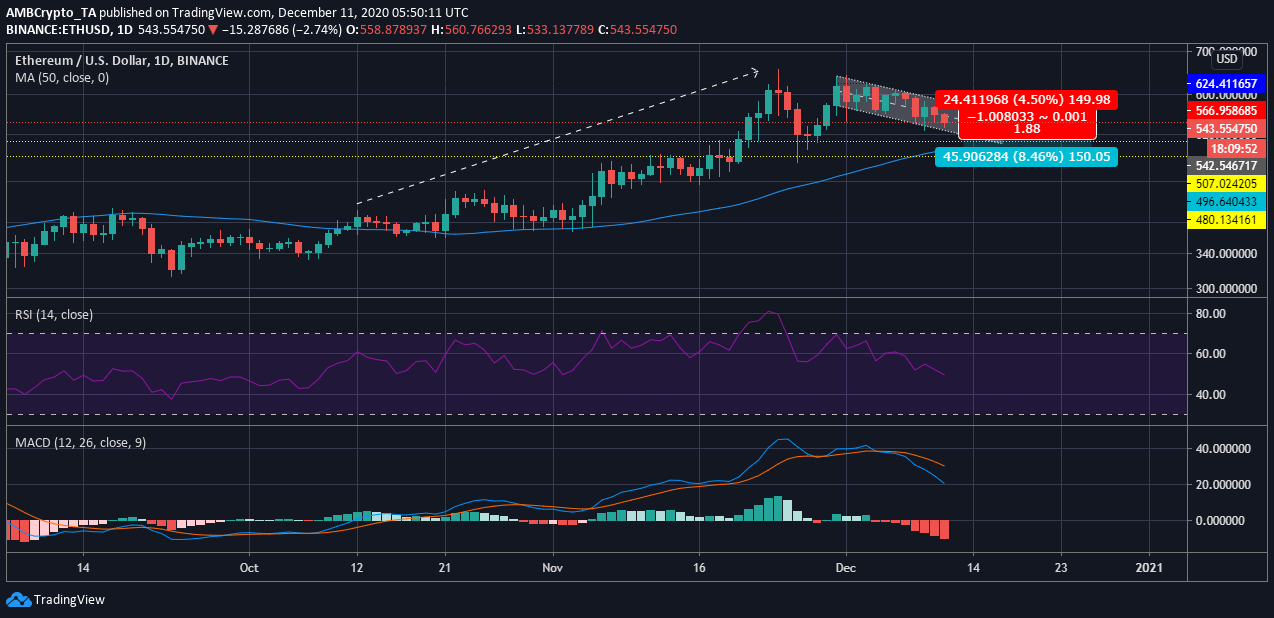
According to the attached chart, Ethereum’s price was descending along a sloping channel. The price had peaked at $641 and since then, it has been falling. The selling pressure in the Bitcoin market also contributed to the price of the digital asset heading south, given its correlation. ETH’s price has been struggling and selling pressure could make its way into the Ethereum market, a development that would herald the time to short it in the long-term.
Reasoning
The bearishness in the market has been increasing of late. The crypto-asset’s drop in value was triggered by its bullishness being taken over by the market’s bears. Although the 50 moving average was under the price bars, it was approaching a point of crossover, something that pointed to the declining price of Ether.
On the contrary, the Relative Strength Index was witnessing the value reach a point of equilibrium from the overbought territory. At the time of writing, the buying and selling pressures on Ethereum had evened out, but the Signal line was pointing downwards, indicating that a further sell-off could be possible.
Further, the MACD indicator was also noting the rising bearishness as the bars were under zero and each one was longer than the previous one. The MACD line was under the Signal line, something that also highlighted the bearishness in the market.
Positions
Entry: $543
Stop-Loss: $563.54
Take-Profit: $493.45
Risk-to-Reward: 2.41
Conclusion
In the long-term, the value of Ethereum will be expected to drop as the bearishness rises. The traders can make a profit at $493.35 as this was a point between the two supports at $507 and $480 while the resistance level remained at $624.


