Ethereum, MATIC and Polkadot Price Analysis: 09 August

Bitcoin and Ethereum tanked 1.6% and 3.5%, respectively while ETH continued to move south after failing to topple $3165 resistance. Other altcoins displayed similar movements on their charts. MATIC’s price could fall below the one dollar mark while DOT fell by 2.1%.
Ethereum (ETH)
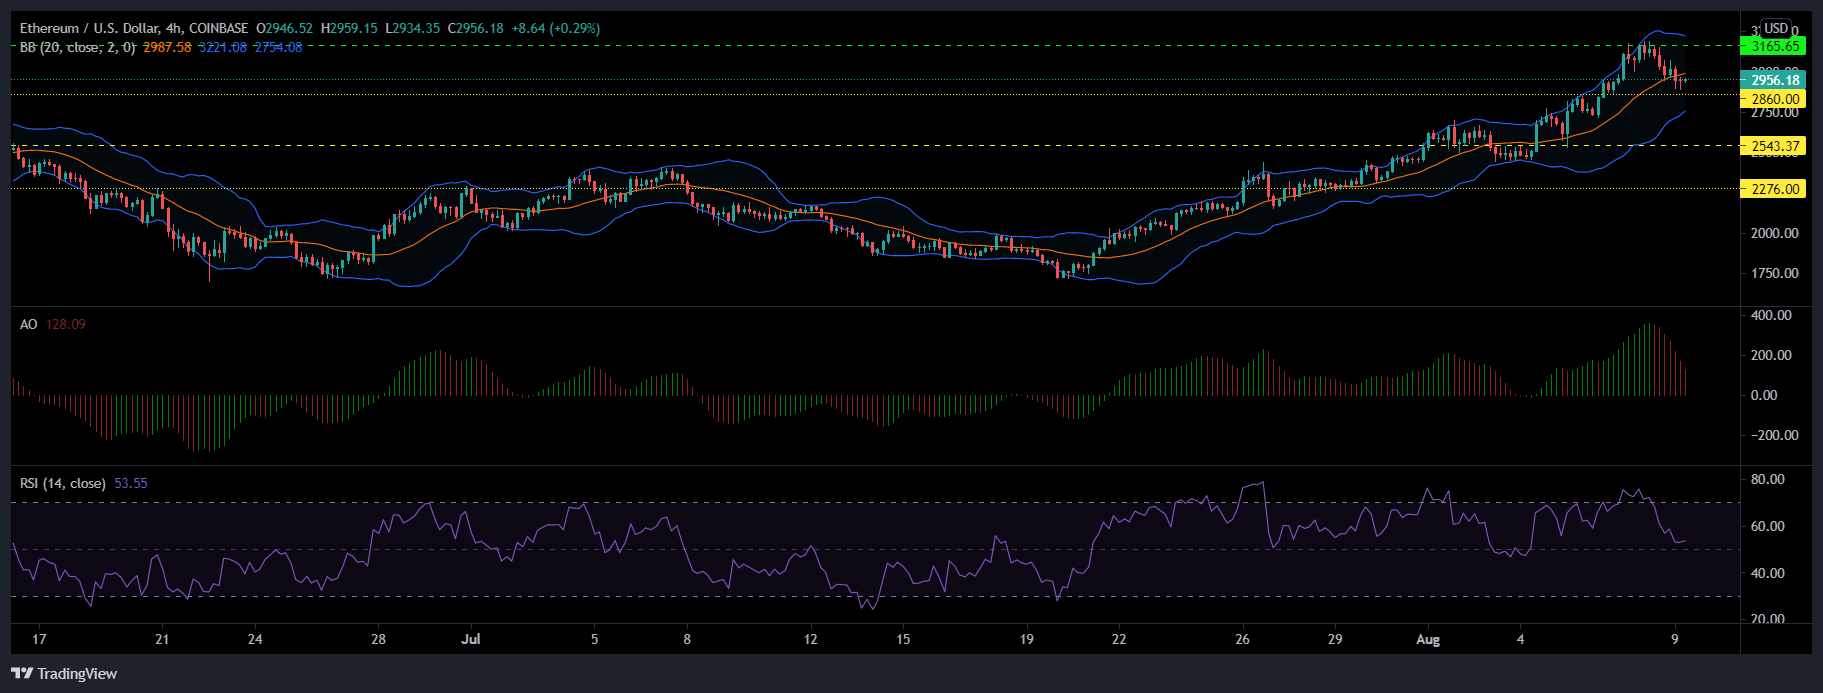
Ethereum trickled down by 3.5%, and it was priced at $2956 at the time of writing. The immediate support line for ETH stood at $2860. If prices sustain at $2860, it could test its $3165 resistance level for the second time.
Bullish forces had lost steam as indicated on the 4-hour chart. The Awesome Oscillator marked strengthening of red signal bars, affirming the same. The Relative Strength Index also took a dip and traded at the midline.
Lastly, Bollinger Bands opened up, however, the indicator showed slight constriction, highlighting a fall in market volatility.
Polygon (MATIC)
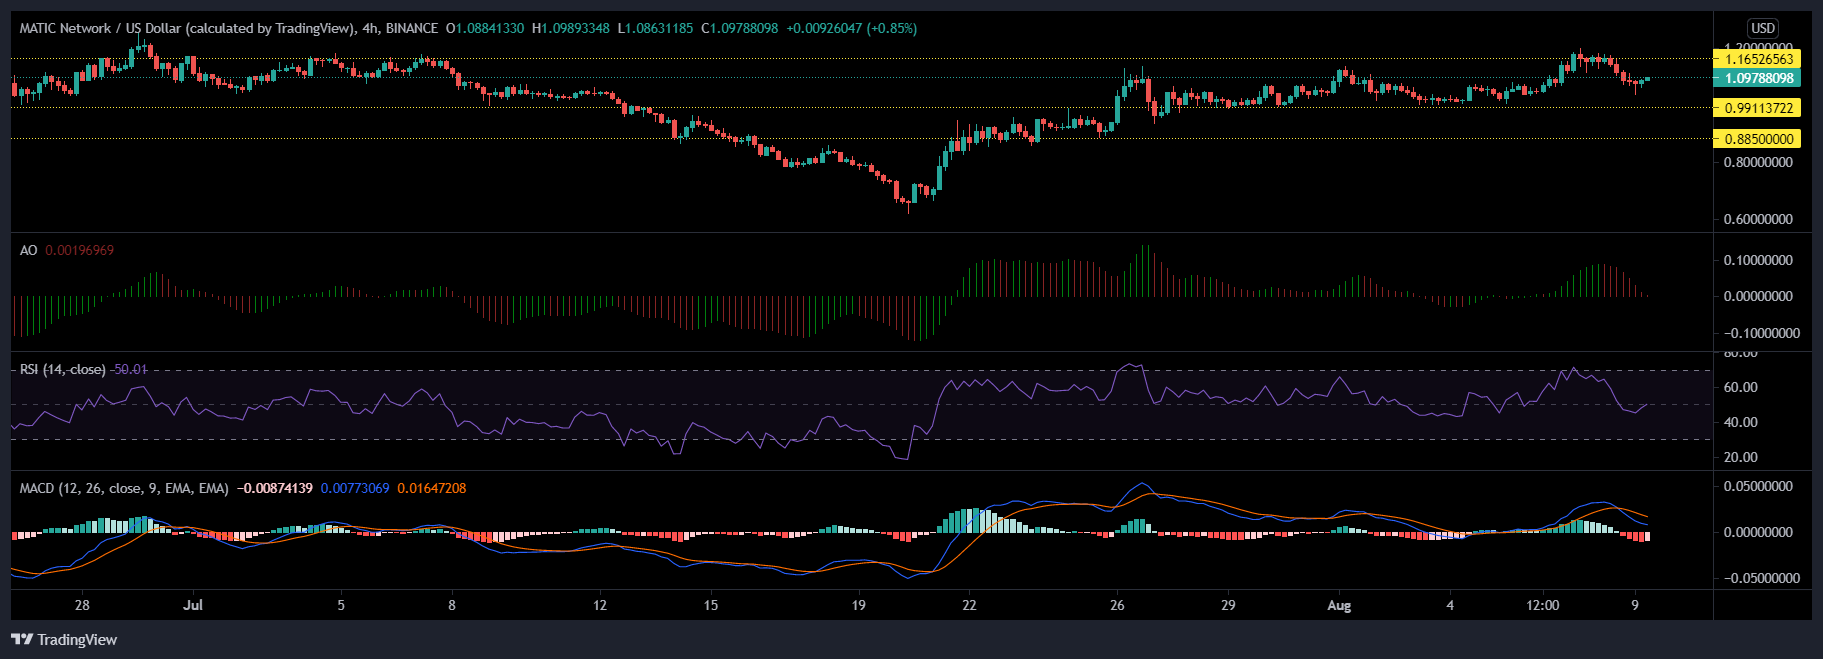
Following broader market sentiments, MATIC retraced as it traded for $1.09 after registering a 3.8% fall over the last 24 hours.
This pullback in prices came after MATIC tried testing the $1.16 resistance level, which the asset has been trying to push above, since the last month. A fall from the current level means MATIC could fall below the dollar mark and rest at $0.99.
Buying strength declined, the Awesome Oscillator and MACD indicated red signal bars above the midline at the time of writing. Relative Strength Index dipped below the half line, however, it noted an uptick as it was pictured at 50-mark.
Polkadot (DOT)
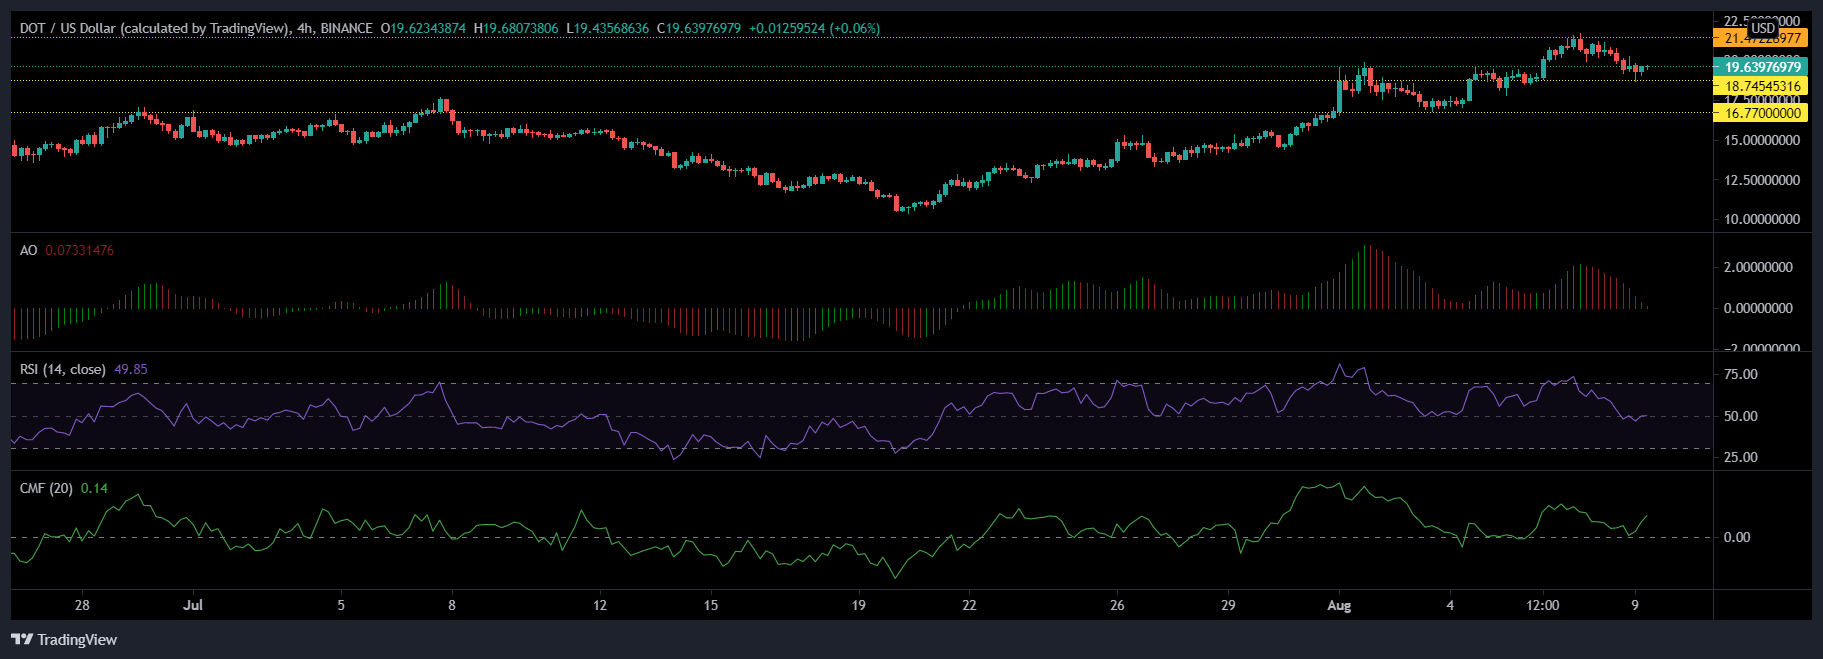
At the time of writing, DOT was valued at $19.67, after it slid off by 2.1% over the last 24 hours. It experienced resistance at $21.42 and inched closer to its $18.74 support level.
Buying pressure was also affected negatively as the Relative Strength Index dipped and traded on the midline. Awesome Oscillator too validated lessened buying strength and gave off bearish signals as the red signal bars were on the rise.
Conversely, the Chaikin Money Flow experienced a rise in capital inflows over outflows while still remaining within the bullish territory.