Ethereum, MATIC, Synthetix Price Analysis: 10 July

Bitcoin’s hike of 2.8% pushed the crypto to trade at $33,780, at press time. However, Ethereum didn’t quite register an increase in price over the last 24 hours. MATIC held on to the same price of $1.04 for 24 hours, even at the time of writing. Finally, Synthetix after registering an all-time high fell by 2.2% on the charts.
Ethereum [ETH]
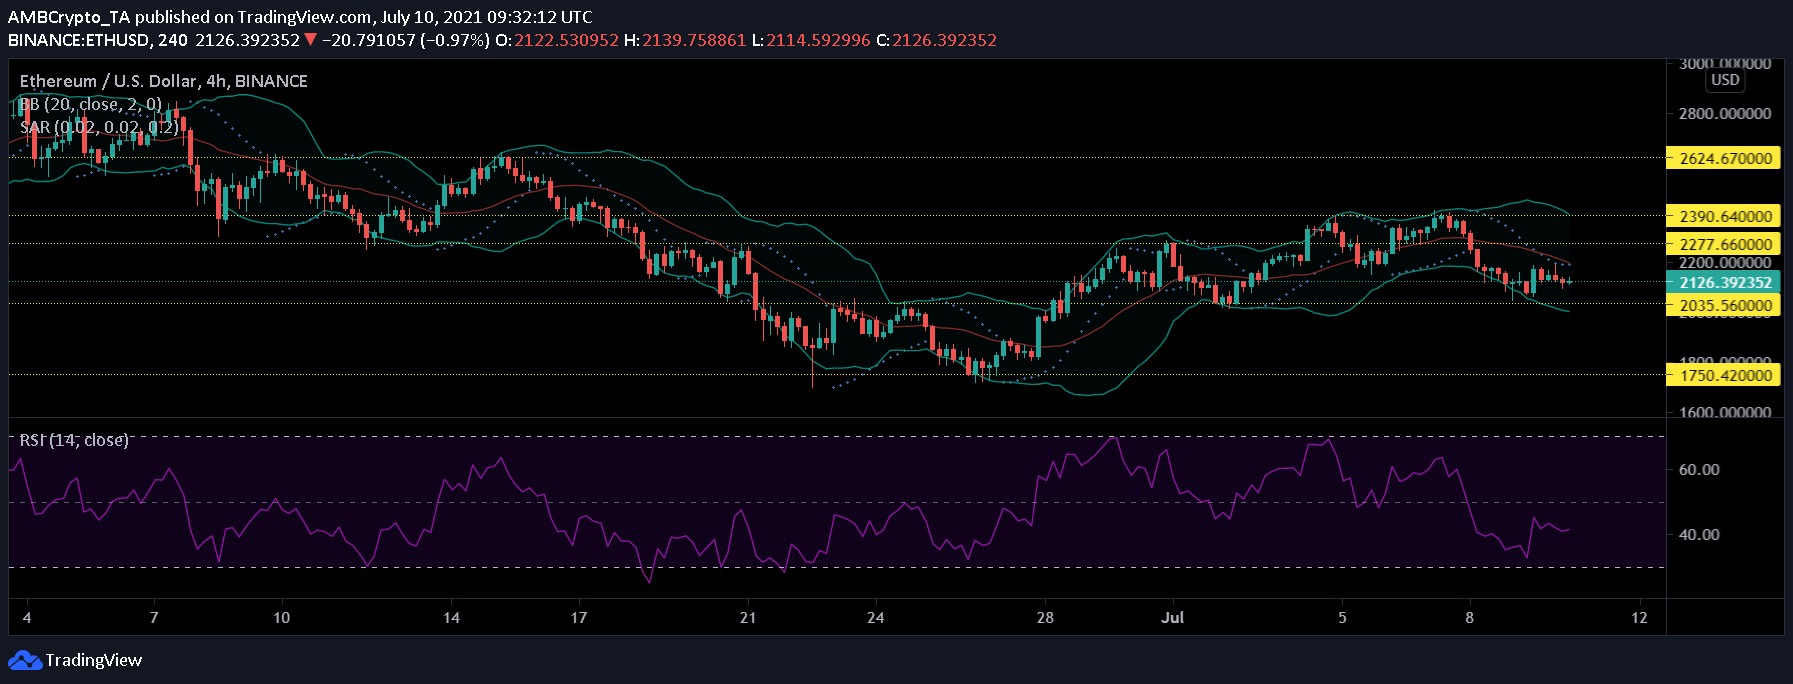
Ethereum could soon test the $2035 support level if its price continues to fall. In fact, if it falls further, the altcoin could again test the $1750 support level.
The Relative Strength Index, at press time, registered a marginal uptick, one which meant that buying pressure rose slightly. However, selling pressure still dominated the market. The Bollinger Bands were wide on the charts and signaled a consistent hike in market volatility.
Finally, the Parabolic SAR affirmed the ongoing price downtrend as the dotted lines were visible above the price candlesticks.
MATIC
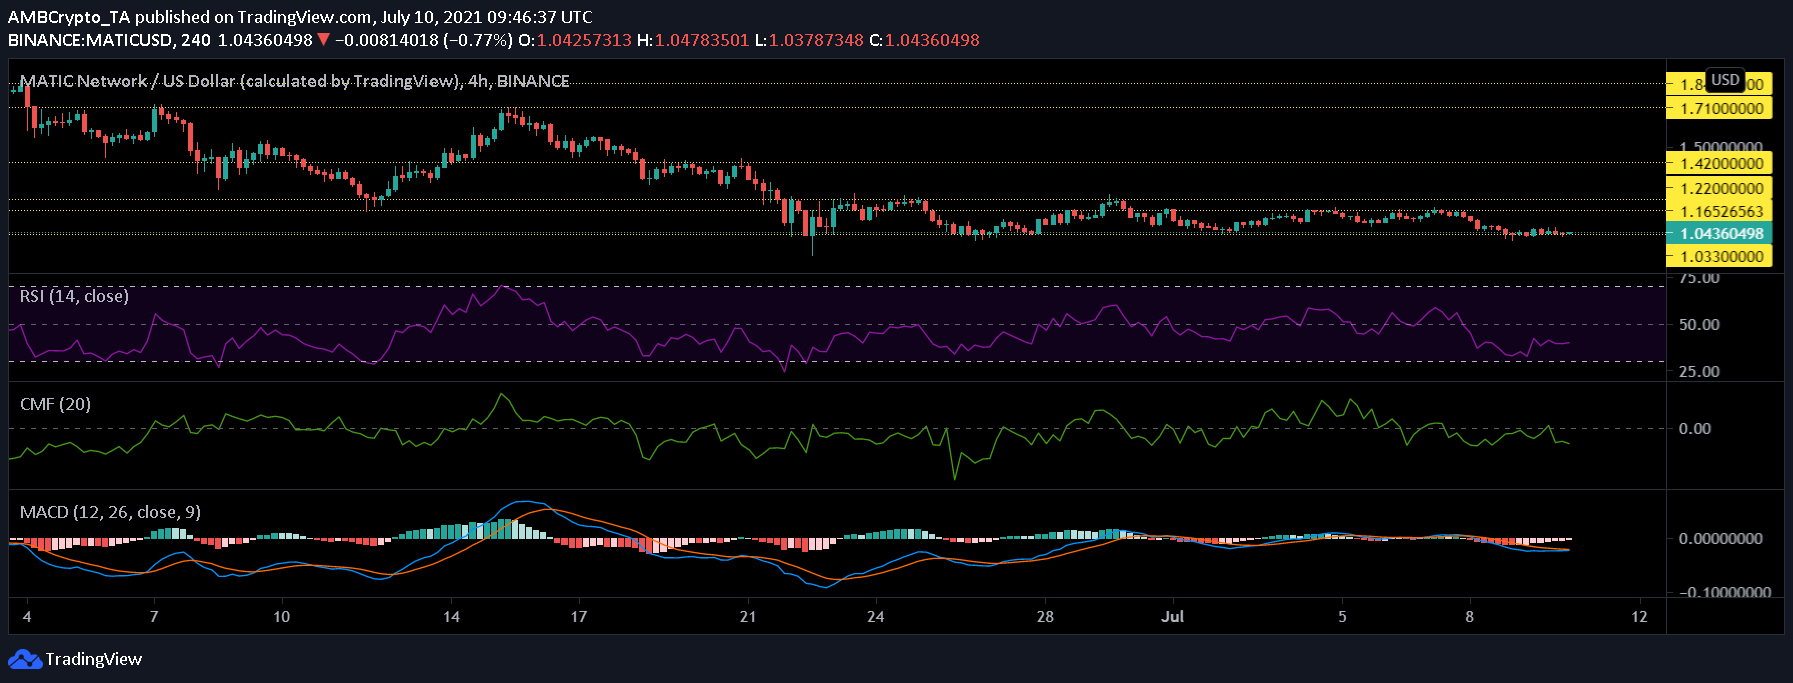
MATIC’s price action has been trendless for the longest time, with the alt moving sideways since 22 June. At press time, the altcoin was still valued at $1.04, a price level that it has held on to since the last 24 hours. Over the past 7 days. MATIC registered a 6.2% loss in value, with quite a dip noted in terms of buying pressure across the market.
The Relative Strength Index was pictured underneath the median line, with dominant selling pressure at the time of writing. The Chaikin Money Flow also pictured a drop in capital inflows as outflows remained consistently high.
The MACD indicator has been noting bearish signals over the last few trading sessions stretched over the last few days. However, at press time, bullish signals had the potential to crossover the bearish signal.
Synthetix [SNX]
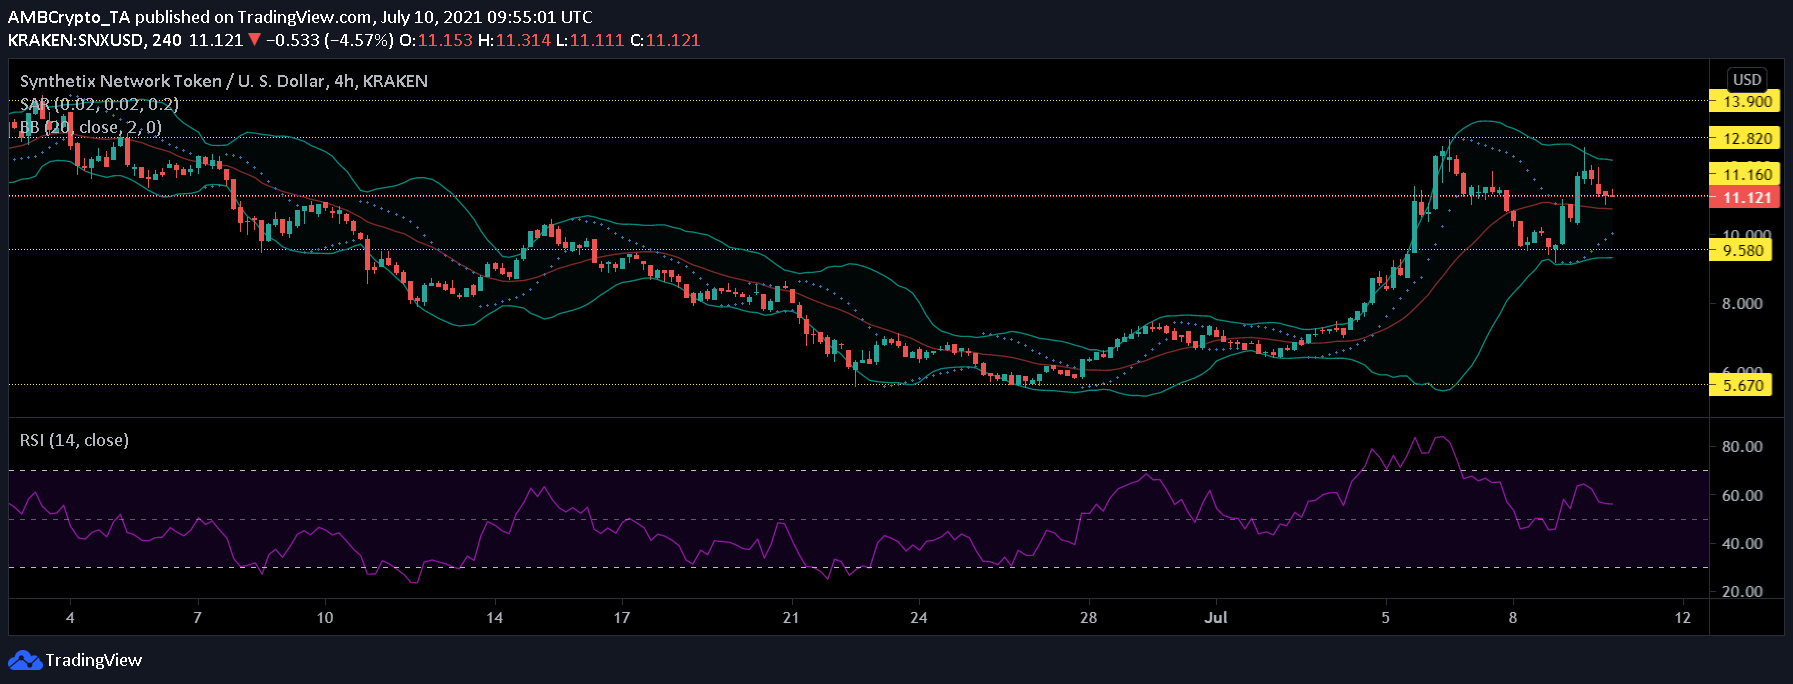
The latest choppiness in SNX‘s price came in after DeFi and Non-Fungible Tokens gained momentum. The coin rallied by 100% just a few days back after hitting an all-time high of $12.50. Over the last week, the altcoin gained tremendously and registered a 60% hike in price. At press time, SNX was available at $11.12 on the back of a 2.2% decline.
If the price continues to fall, then the token could find support at the $9.58 level again and with an increase in price, the alt could try testing the $12.82 resistance level.
The Relative Strength Index fell from the overbought zone before stabilizing above equilibrium. The Bollinger Bands held their width and suggested that the price could slightly fluctuate over the upcoming trading sessions.
Finally, the Parabolic SAR revealed that the digital currency was on an uptrend, given how the price was on the rise.