Ethereum presents selling opportunity, should you take up the offer?
Ethereum's fall below the month-long range showed bearish intent, but will this result in a move toward the next support zone on the chart?

Disclaimer: The information presented does not constitute financial, investment, trading, or other types of advice and is solely the writer’s opinion.
- The market structure remained bearish, and the drop below the range represented a selling opportunity.
- An ETH move back above the $1850 and $1880 levels would show bulls clawing their way back into the driving seat.
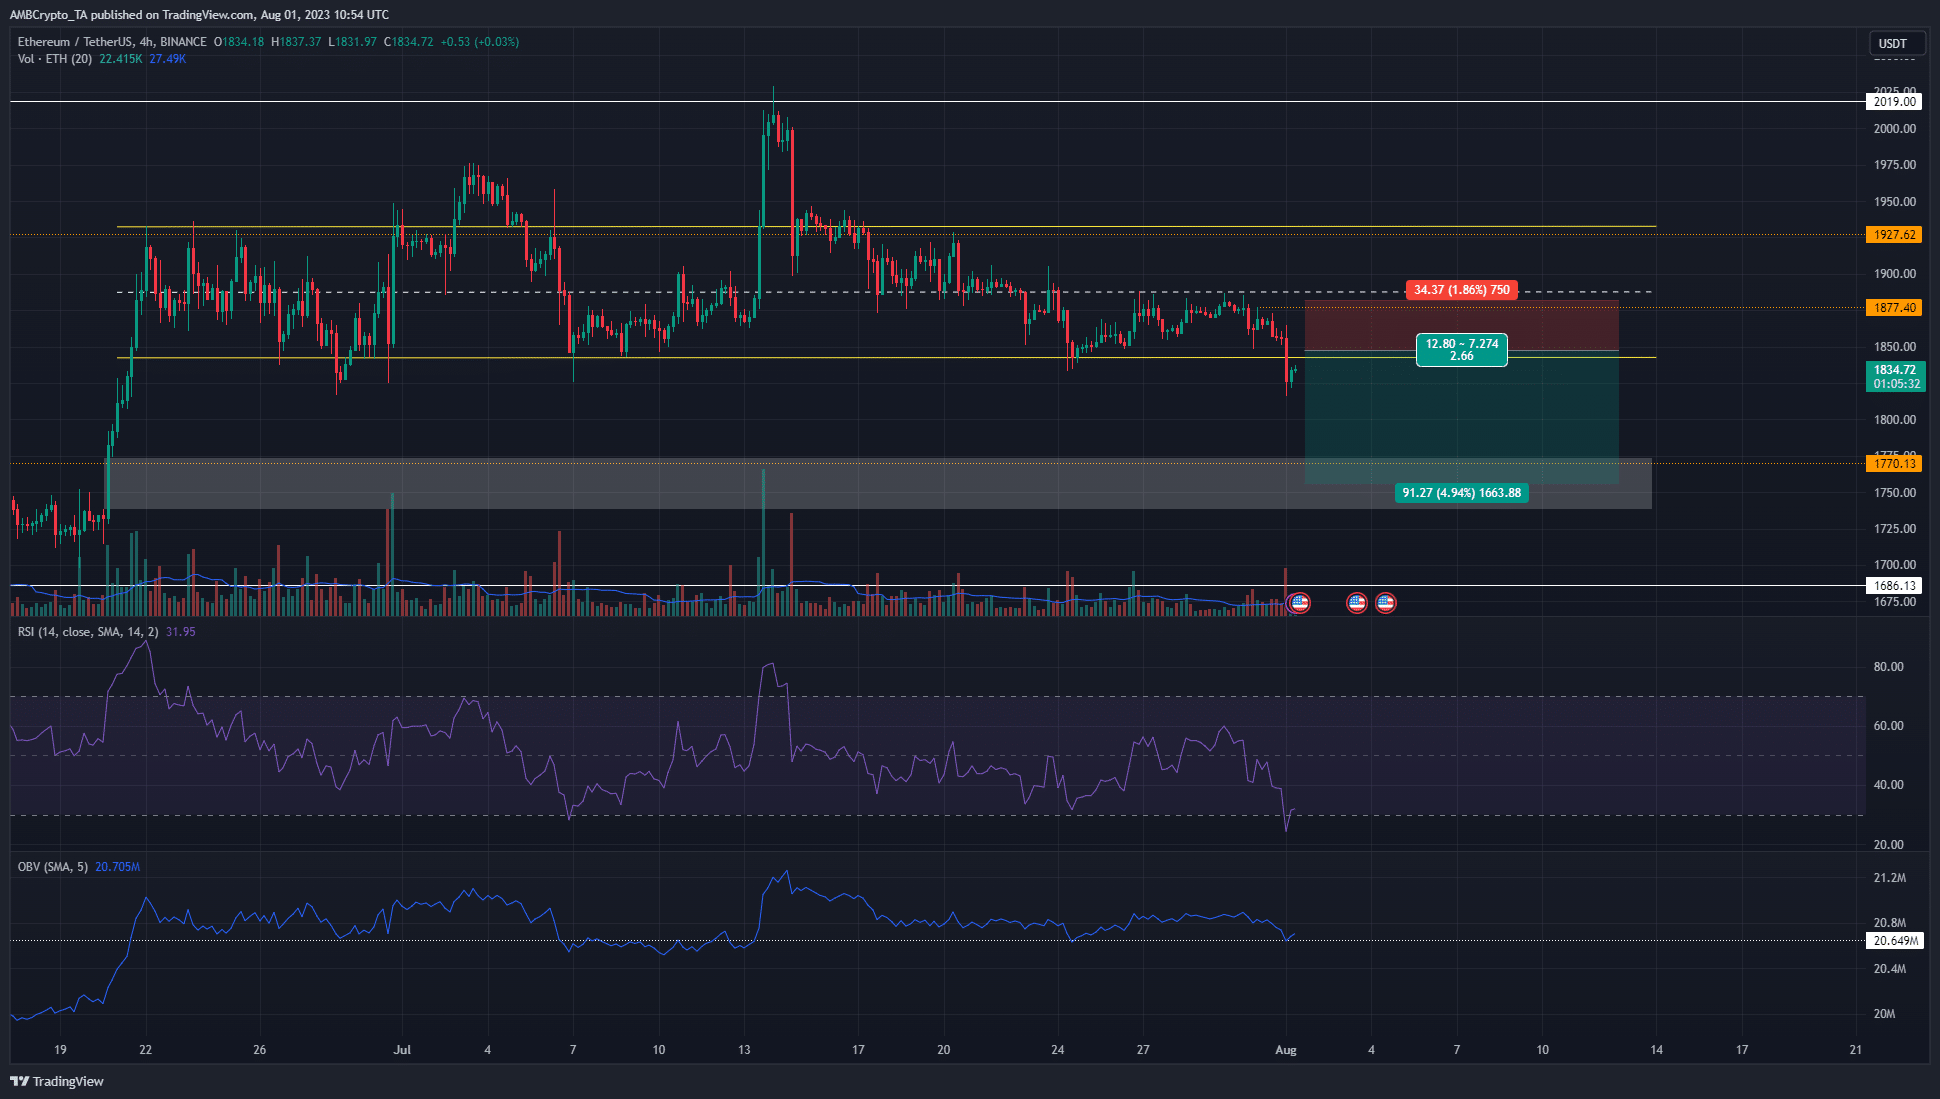
Ethereum [ETH] has traded within a range since 21 June. A few hours before press time, the price closed a 4-hour trading session below the range, which extended from $1837 to $1933. This was a signal that ETH sentiment was firmly bearish.
Read Ethereum’s [ETH] Price Prediction 2023-24
Short-term bears on ETH could look for selling opportunities upon a bearish retest of the range lows. Bitcoin [BTC] also sank below the $29k level after seeing little volatility over the past week. Could this be the start of the next leg downward?
The short setup on Ethereum – deviation or bearish continuation?
Whenever the price drops below a relatively longer-term range, short-term traders can ask pertinent questions – is it just a deviation? What’s to say the price won’t bounce back into the range? Time is the only thing that can answer the questions definitively.
At the time of writing, on the 4-hour chart, we have the RSI below the neutral 50 mark, showing downward momentum was strong. ETH’s price action exhibited a bearish market structure as well. The drop to the $1817 mark occurred during a session with significant trading volume.
The OBV clung to a support level from June, but the bears were unable to force it to fall lower. The H4 session close below the range low meant short sellers could look to enter the market upon a retest of the $1844 level. Their invalidation would be the lower timeframe lower high at $1880.
To the south, a large fair value gap was present in the $1770 region. A move to this zone can be used by ETH short sellers to book profits.
Coinalyze data highlights strong bearish sentiment
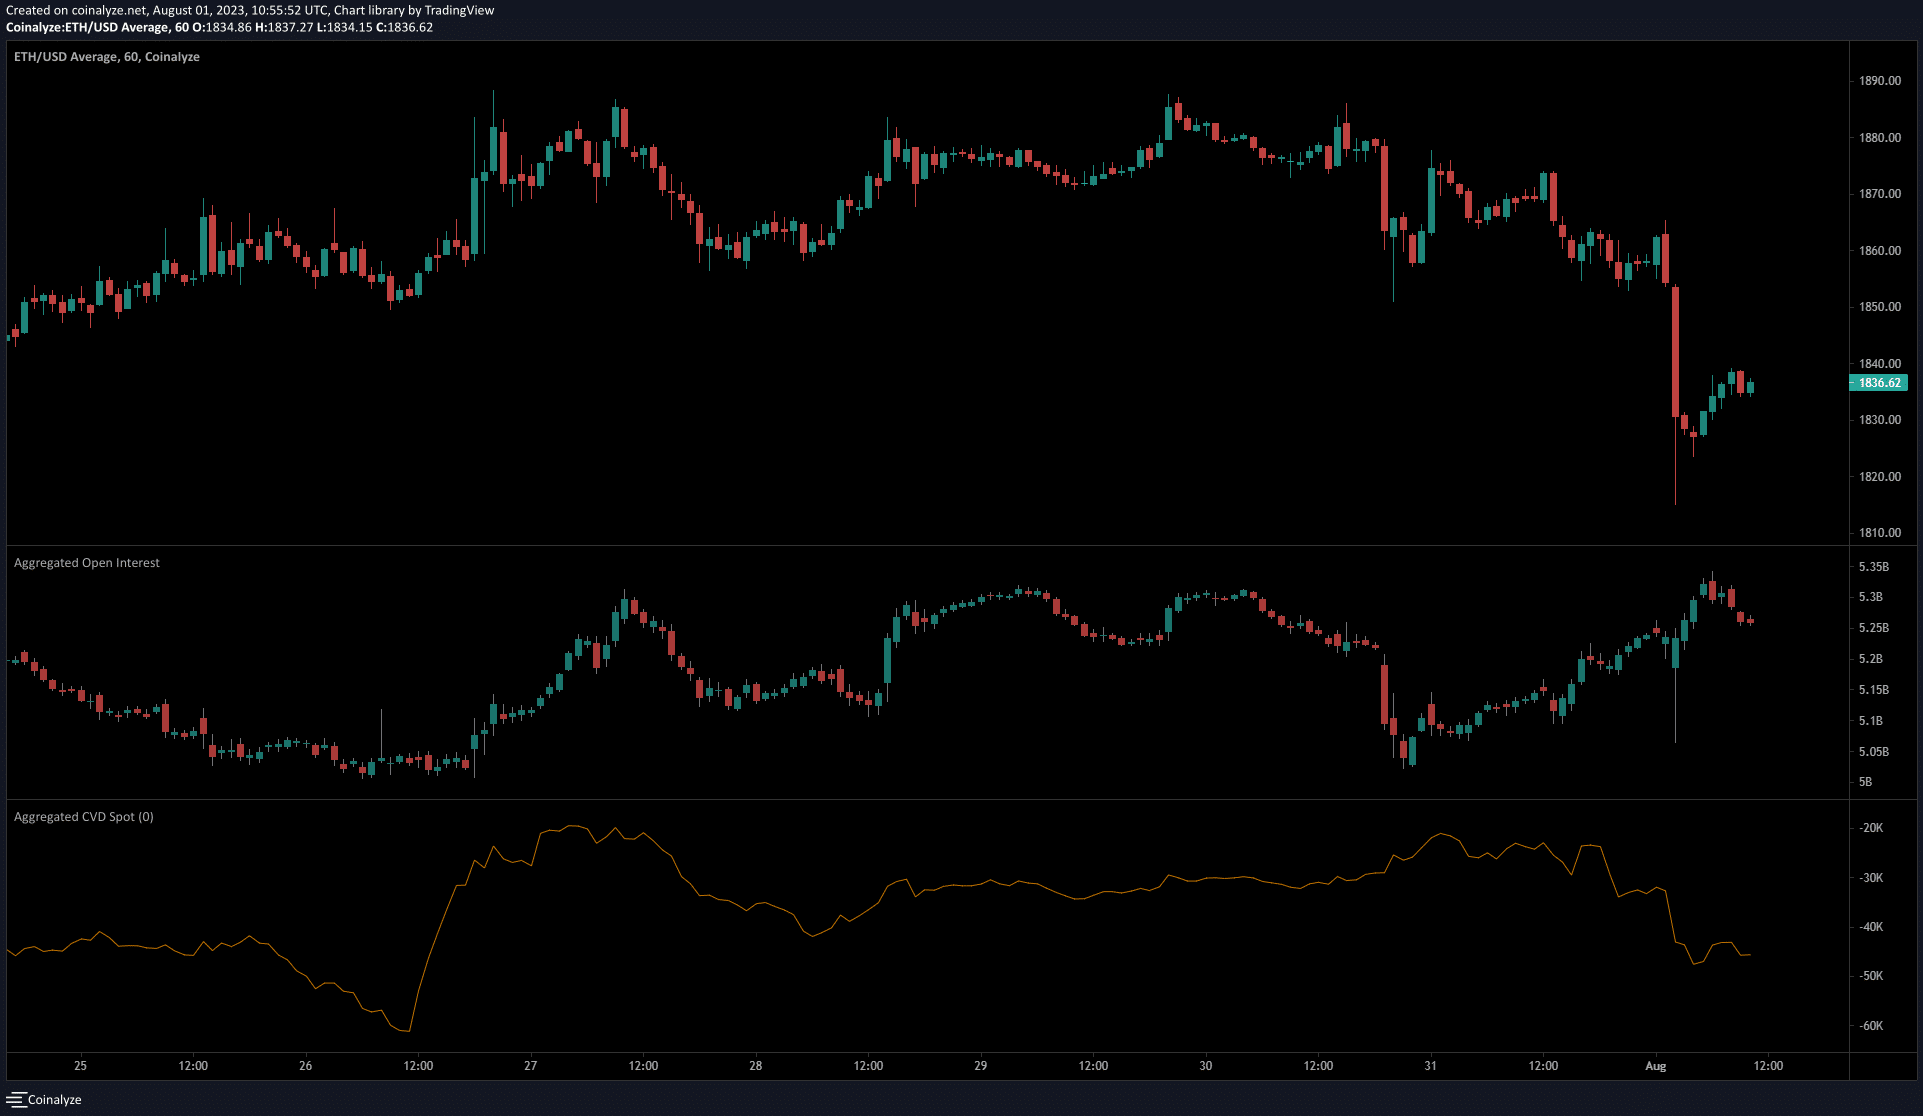
On 31 July, Ethereum began to fall from $1874 to reach $1815 on 1 August, a 3.2% move. The Open Interest climbed rapidly from $5.1 billion to $5.3 billion as prices fell lower. This indicated speculators were firmly bearish.
Is your portfolio green? Check out the Ethereum Profit Calculator
As prices bounced in recent hours, the OI began to descend. This suggested short positions could be closing during the bounce, while sizeable bids did not enter the market.
The spot CVD fell over the past 48 hours to underline significant selling pressure behind ETH.