Ethereum Price Analysis: 08 February

Disclaimer: The findings of the following analysis are the sole opinions of the writer and should not be taken as investment advice
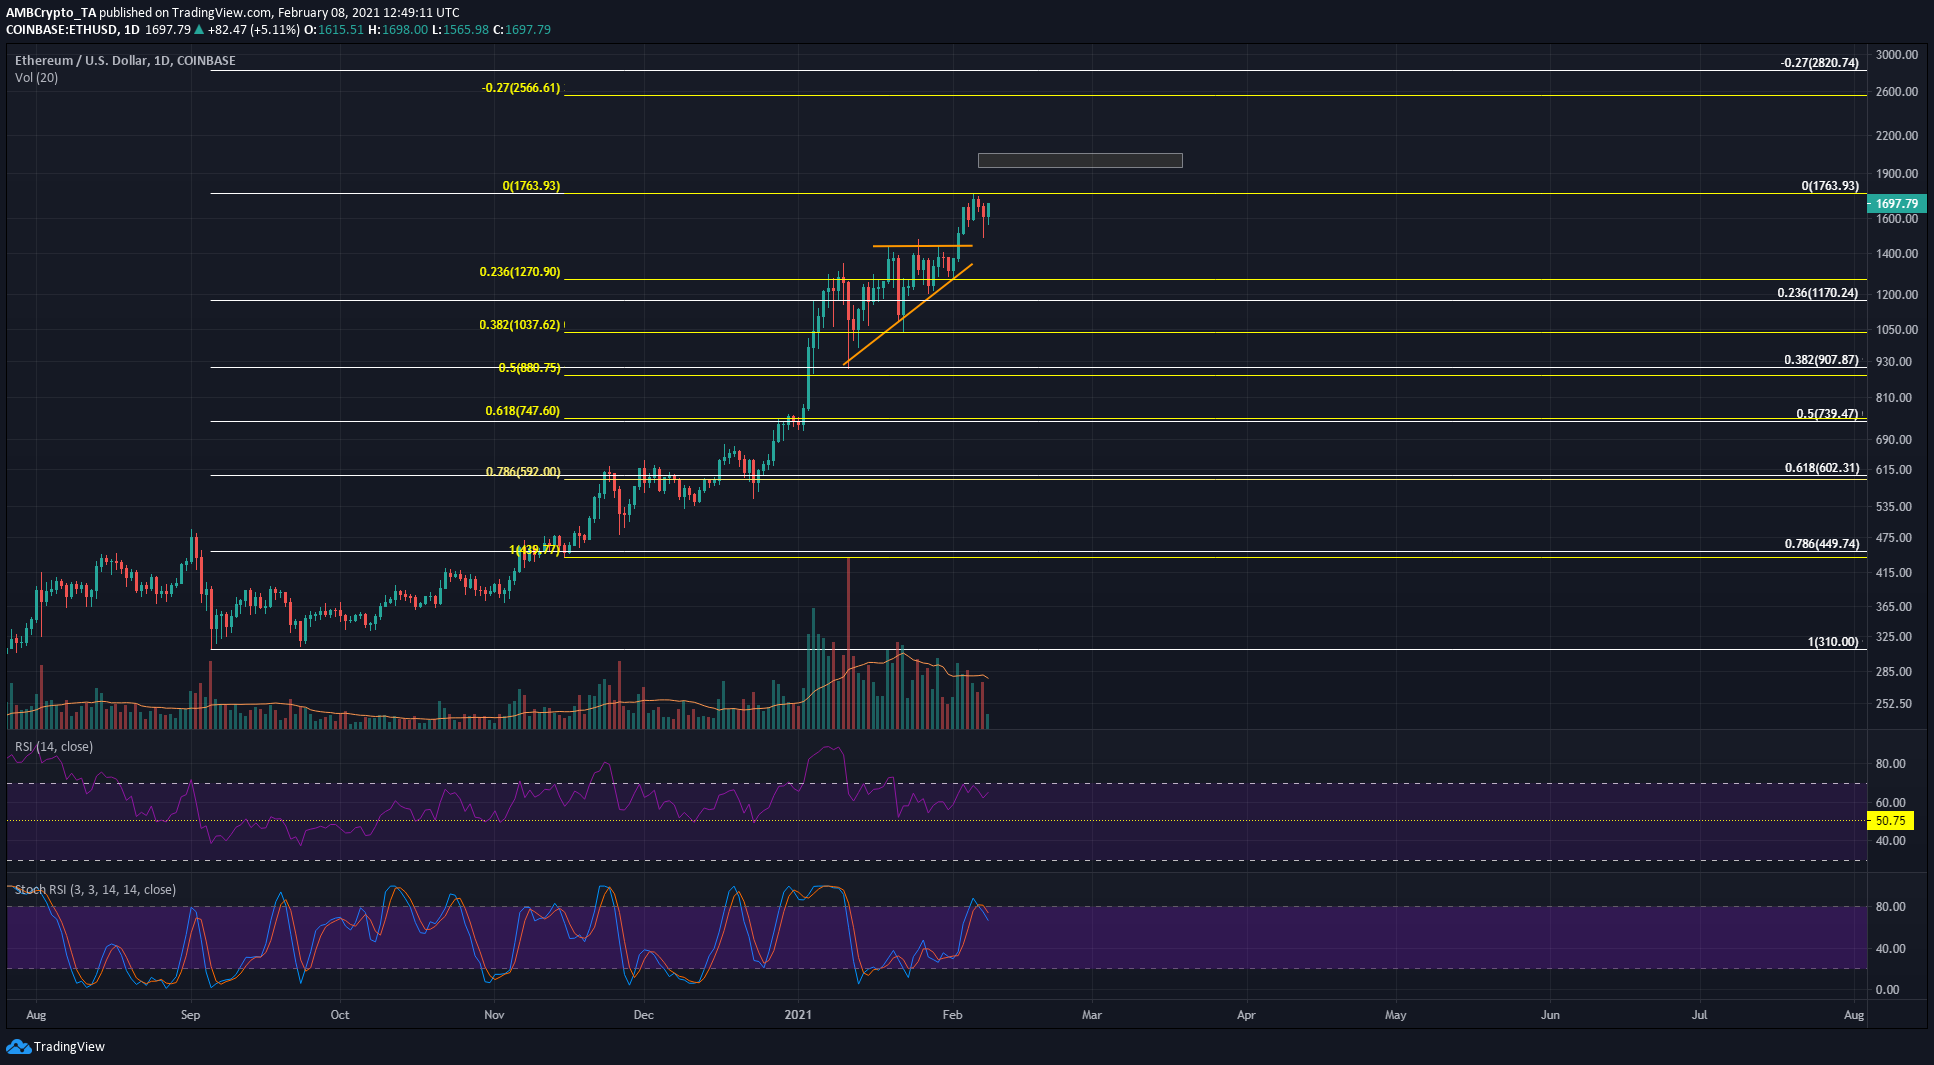
Ethereum formed an ascending triangle pattern on the charts but faced some resistance at the $1760 mark. While high gas fees are a blow to decentralized exchanges, they could also persuade users to turn toward competitors such as Polkadot and Solana.
Ethereum 1-Day chart

Source: ETH/USD on TradingView
Using the Fibonacci retracement tool for two moves to the upside for ETH, some confluence between the retracement levels was seen and this highlights areas of strong support. More importantly, their confluence lends credence to their extension levels as bullish targets.
At the time of writing, the breakout beyond the ascending channel is yet to achieve its technical target at $1950. The psychological $2000 level is also likely to act as resistance should ETH climb past $1800.
In the course of the next few weeks, a move to $2000 seems inevitable for ETH.
Rationale
The two moves up, whose retracement levels are highlighted, are from $310 to $1763 (white) and from $439 to $1763 (yellow). Their respective 27% extension levels lie at $2820 and $2566 respectively, marking these regions as a take-profit level for investors over the course of the next few weeks.
But before such a move can occur, the highs at $1760 must be cleared and retested to confirm the breakout. The RSI pointed toward bullish strength as it stayed above neutral 50, to indicate an uptrend. The Stochastic RSI, however, was correcting from overbought territory.
The trading volume has also been falling over the past few days as ETH straddled the $1600-$1700 area.
With the price making higher highs, a bearish divergence was seen between the price and RSI, which made lower highs. This divergence has likely not yet played out, and another rejection at $1760 could see it revisit $1450.
Conclusion
While the bearish divergence on the daily chart and falling trade volume paint some signs of weakness, the long-term trend of ETH remained strongly bullish. Targets for ETH are highlighted, with $1950 and $2000 being levels that ETH could reach before entering its next phase of retracement and accumulation.


