Ethereum Price Analysis: 23 January

Disclaimer: The findings of the following analysis are the sole opinions of the writer and should not be taken as investment advice
Ethereum’s price registered a new ATH on the charts recently. However, despite corrections setting in and its high correlation with Bitcoin, ETH managed to keep its losses to a minimum over the past few days.
Interestingly, over the past week, Ethereum has also seen its price consolidate and trade sideways as it stuck to the narrow confines of its immediate resistance and support. However, in the coming week, is the coin likely to endure a bigger price correction? And, will it be able to sustain its position close to the $1,000-price level?
At press time, Ethereum was trading at $1,255 with a market cap of over $144 billion. The cryptocurrency registered a 24-hour trading volume of $33 billion, with the same hiking by close to 4.5 percent over the past week.
Ethereum 1-day chart

Source: ETH/USD, TradingView
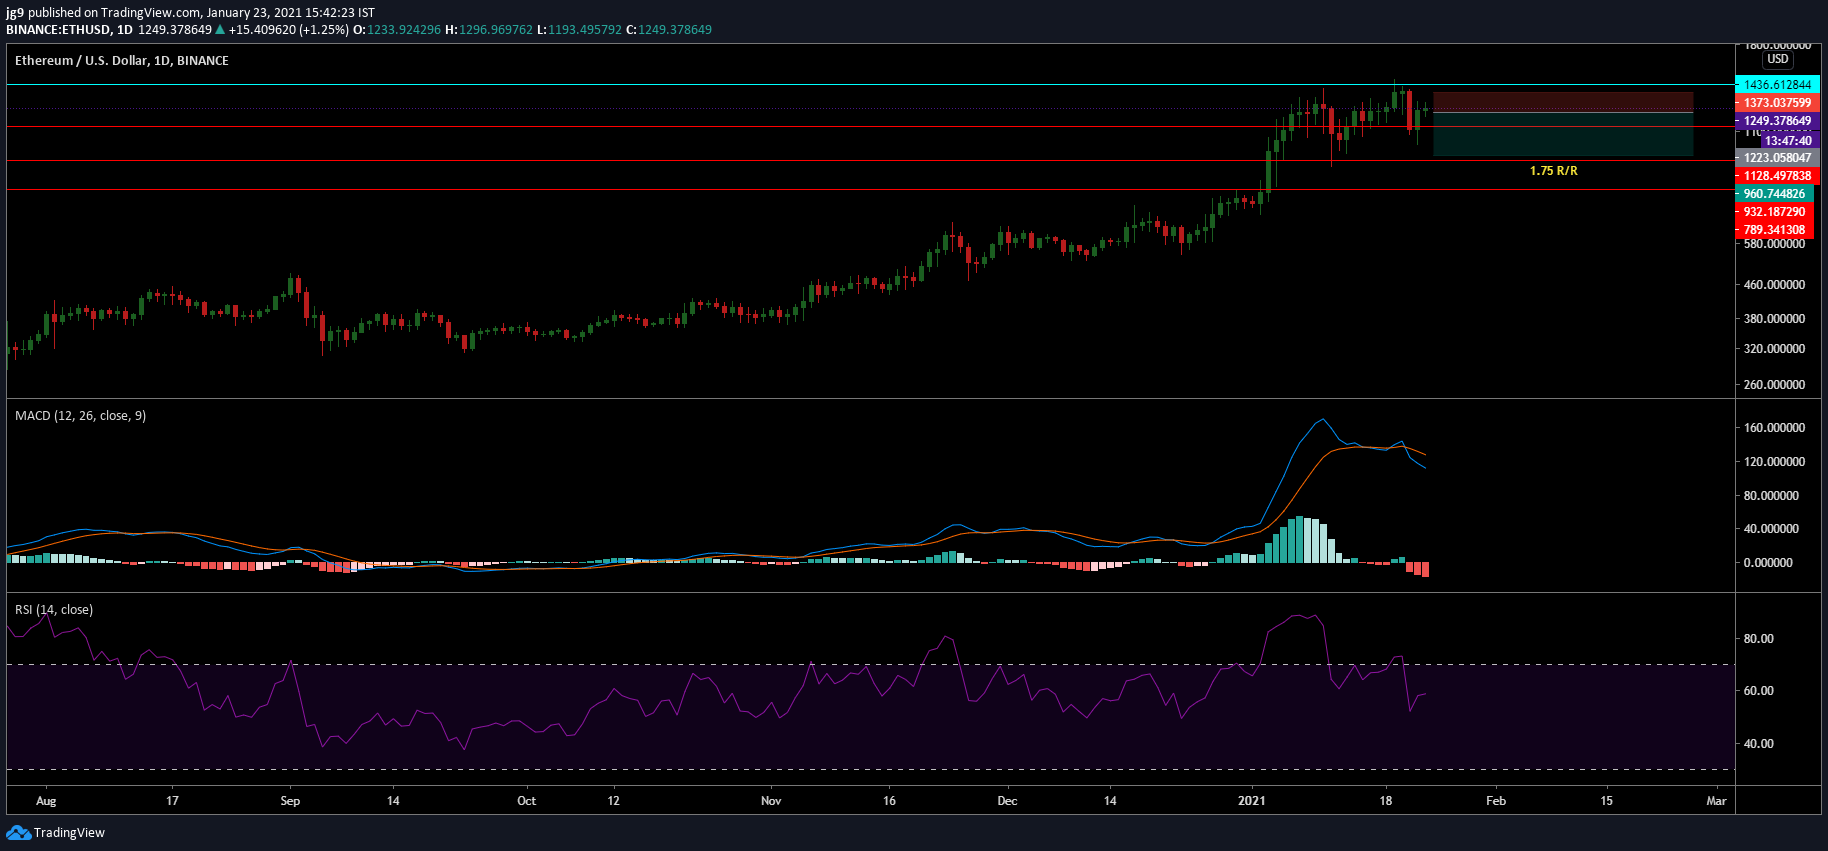
According to Ethereum’s one-day chart, ETH has seen its price move between its resistance at $1,436 and its immediate support at $1,223. However, it is important to note that in the last 24-hours, the coin’s immediate support was breached, despite the bounce-back on the charts. The coin also registered another strong support around the $932 and $789-price range.
Given the overall market sentiment, it is unlikely that ETH will meet the $789-price level. However, in the coming week, a move to $932 cannot be discounted. For traders, this presents an opportunity to open a short position as the coin looked likely to see an upcoming drop in price.
Reasoning
The technical indicators for Ethereum were bearish, at press time. Its MACD indicator underwent a bearish crossover, with the Signal line going past its MACD line, and to make matters worse, there seemed to be no real possibility that a reversal was likely in the short to medium term.
The RSI indicator also moved away from the overbought zone, with the same moving slightly closer to the neutral zone while highlighting the falling bullish sentiment in Ethereum’s market.
Important levels to watch out for
Resistance: $1436.6
Support: $1128, $932 , $789
Entry: $1223
Take Profit: $960
Stop Loss: $1373
Risk/Reward: 1.75
Conclusion
While Ethereum has shown a bit of resistance to massive price corrections, the next few days may see the coin register a slight dip. If the coin’s press time support withstands the bearish pressure, this may not happen. However, given the strong bearish sentiment in the market, Ethereum’s price may soon be heading to its second level of support in the next few days.


