Altcoin

Ethereum Price Analysis: ETH stands in Bearish land as price continues to do down
Posted:
| Last updated: August 26th, 2019

Ethereum ranked second with a market cap of around $22 billion and was valued at $208 at press time.
1-Hour
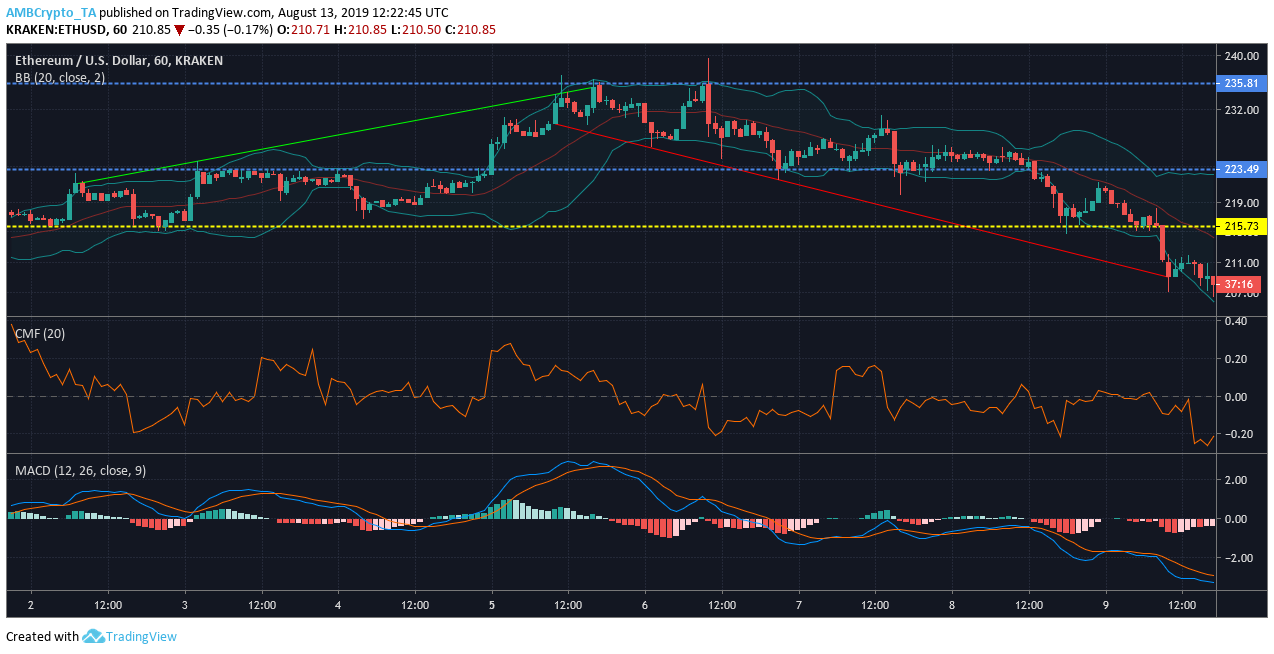
Source: Trading View
On the one-hour chart, a downtrend from $230.46 to $208.79 was noted. The coin recorded an uptrend from $221.34 which extended to $235.29. ETH faced resistance at $223.49 and $235.32, while support is seen at $215.58.
Bollinger Bands were diverging, resulting in reduced volatility in the market.
Chaikin Money Flow pointed at a bearish trend as the marker is seen above the zero lines.
MACD line was below the signal line, indicating a bullish market for ETH.
1-Day
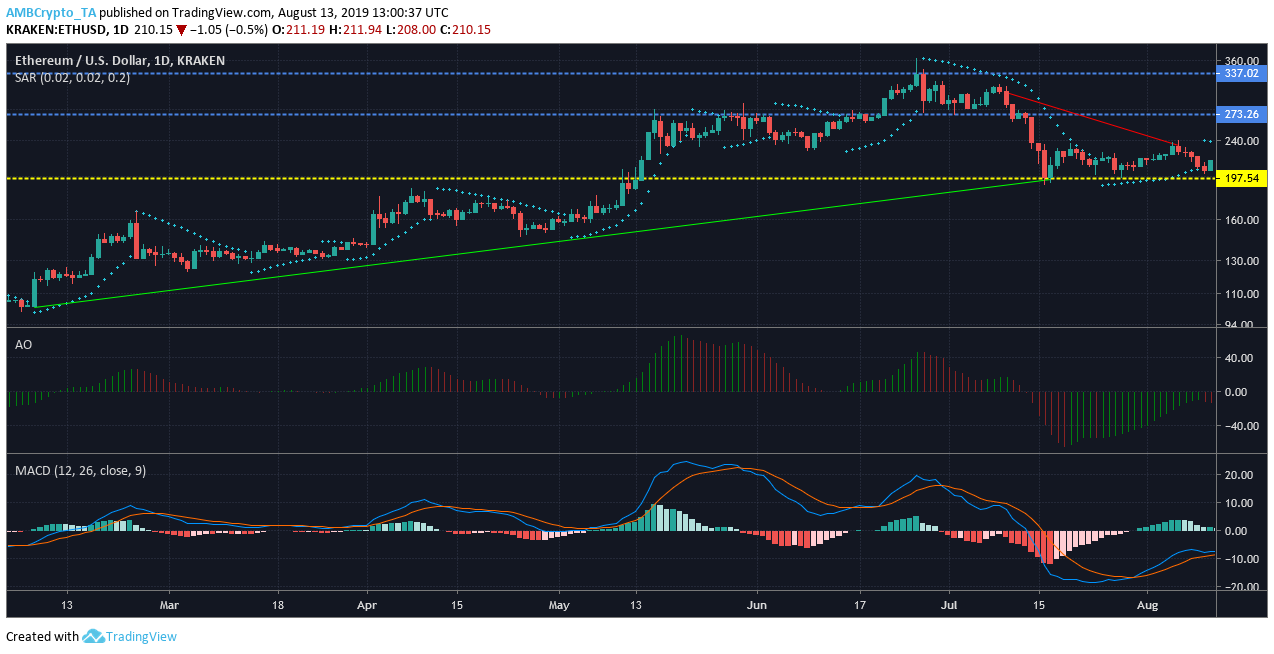
Source: Trading View
If the price of ETH continues to rise it will face resistance at $273.26 and $337.02. ETH saw an upward trend from $103.45 to $197.67 and a downtrend from $307.66 that extended to $232.83.
Parabolic SAR indicated a bearish market as the markers were aligned above the candlesticks.
Awesome Oscillator pictured a bearish selling opportunity.
MACD indicated a bullish trend, as the MACD line hovered over below the signal line.
Conclusion
The charts revealed that ETH showed a bearish trend as per the indicators.