Ethereum: Reasons why ETH’s drop below $1,600 could be crucial for traders

Disclaimer: The findings of the following analysis are the sole opinions of the writer and should not be considered investment advice.
Over the past month, Ethereum [ETH] grew to set foot in the apex region of its long-term rising wedge on the daily chart. Post reversing from the upper band of the Bollinger Bands (BB), the king alt dipped below its 20 EMA (red) and 50 EMA (cyan).
The coin now stood at an important juncture. A potential rebound from the $1,603 support could aid buyers in preventing a continued downtrend. At press time, the alt was trading at $1,639, down by 5.16% in the last 24 hours.
ETH Daily Chart
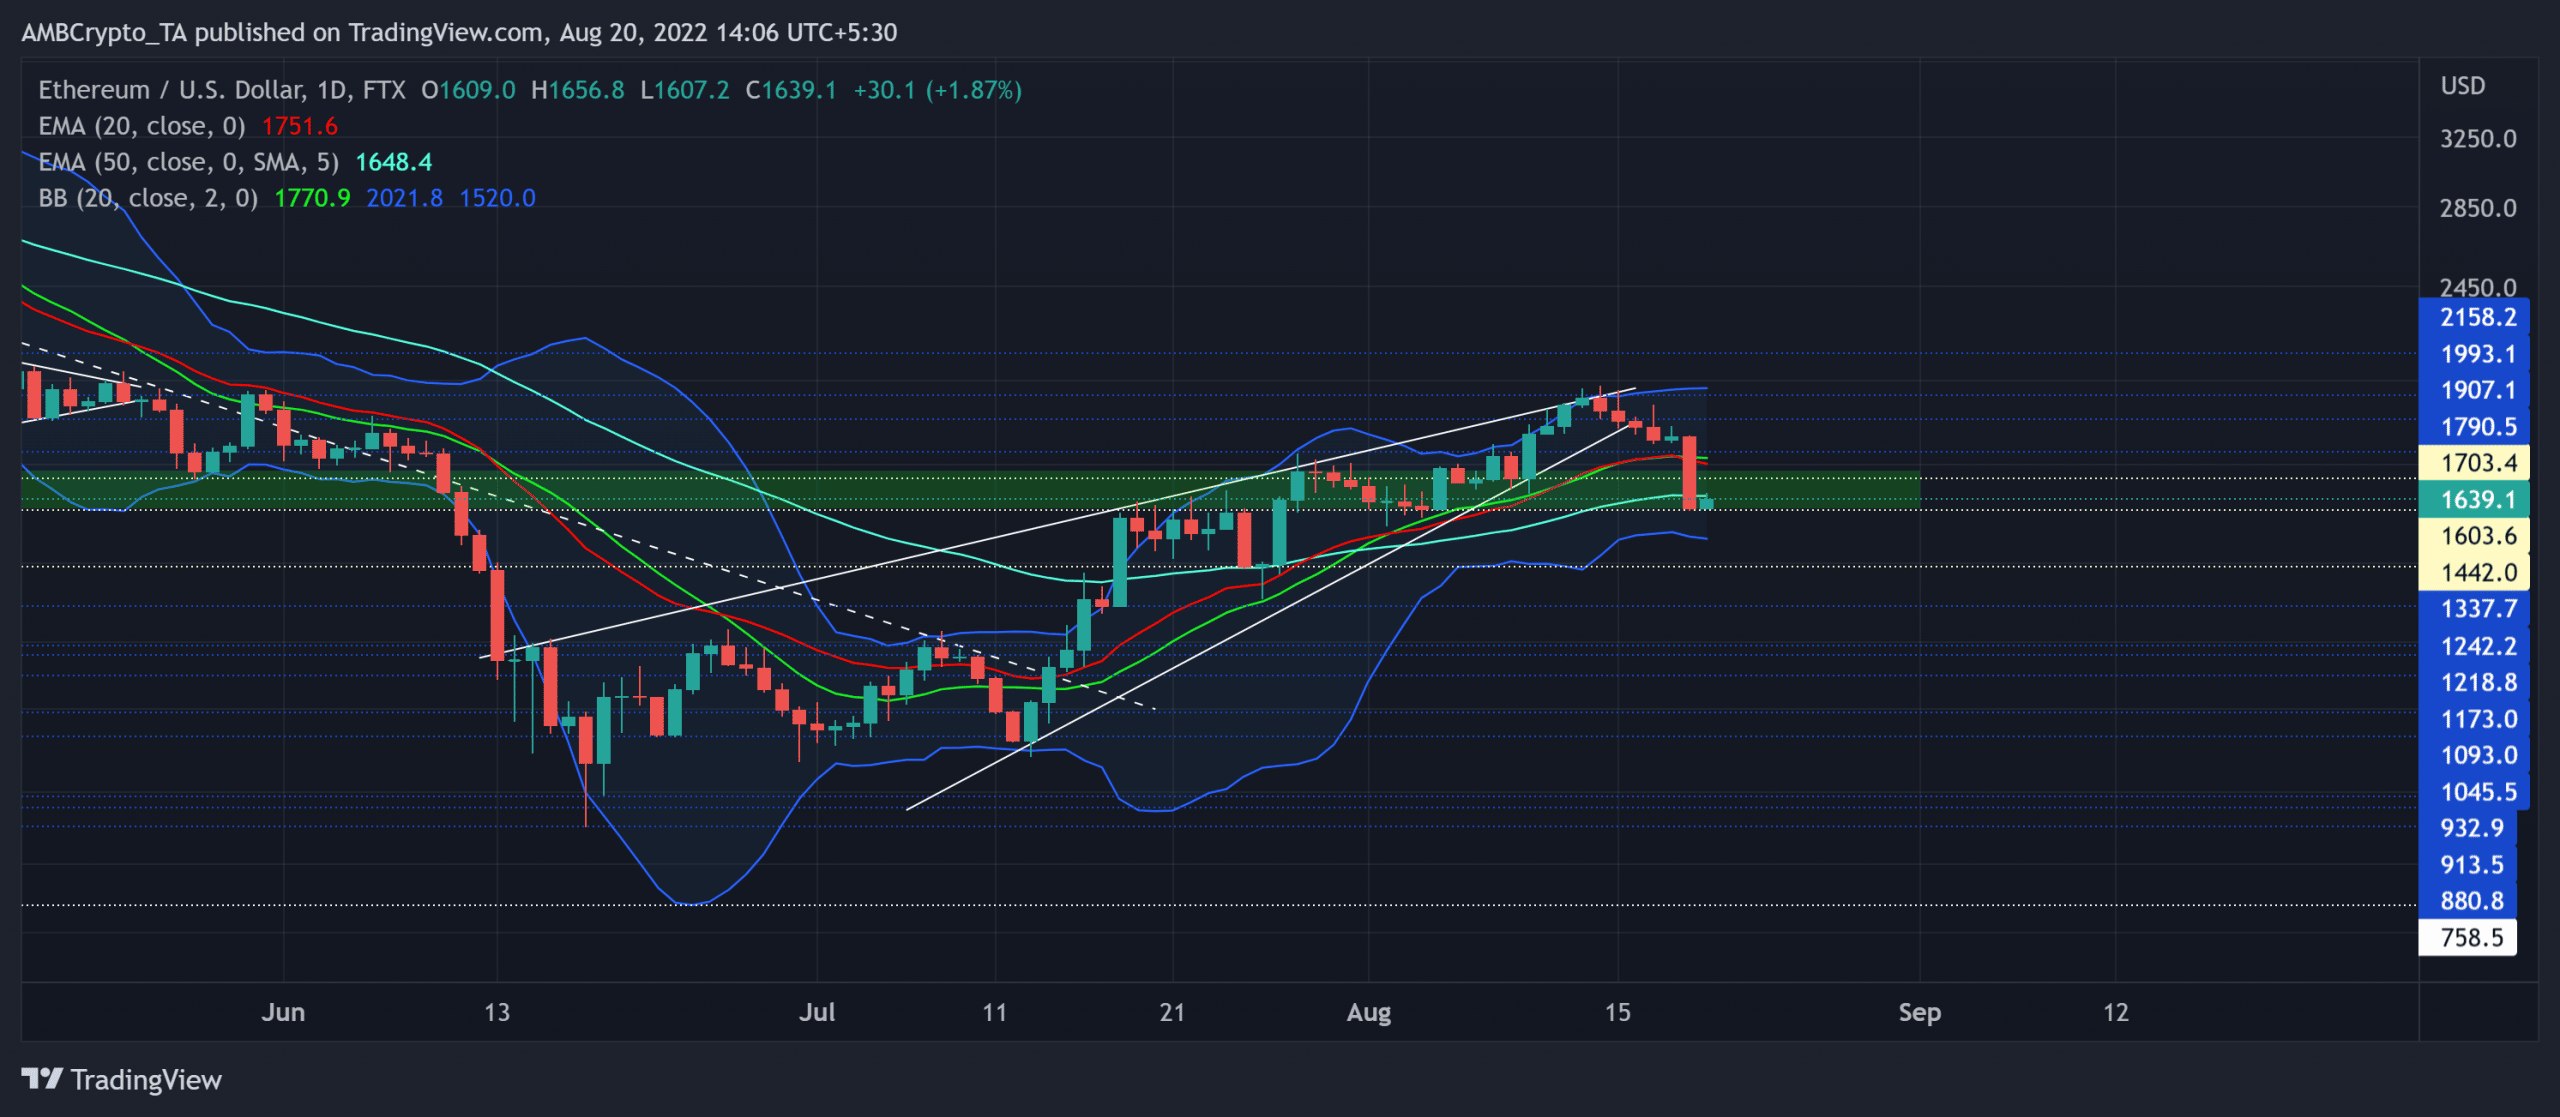
The buying pressure from ETH’s mid-June lows propelled a surge above the basis line (green) of BB. The altcoin saw an over 73% Return on Investment (ROI) from its 13 July low and snapped its vital $1,600-$1,700 range over the last week.
After swaying near the upper band of the BB for over a month, the recent selling resurgence pulled ETH below the near-term EMAs and the basis line.
Should the price action remain below the boundaries of the daily 20/50 EMA, the bears would look to expedite their edge in the coming days. So a convincing close above the 50 EMA could aid ETH in retesting the $1,730 zone. This trajectory could induce a low volatility phase near the EMAs.
Any decline below the $1,603 support could be interpreted as a selling sign. In which case, the $1,500 zone near the lower band of BB could provide near-term rebounding opportunities.
Rationale

The Relative Strength Index (RSI) fell below the midline to reflect a slight selling advantage. Traders/investors should watch for a revival towards the 50-level support to identify prospects of a bearish invalidation. A move near the midline would only reaffirm the slow-moving tendencies of the alt.
The Accumulation/Distribution indicator resonated with the recent plunge but seemingly found a support level. Any recovery from this level would hint at a likely accumulation phase that could ease the recent selling pressure.
Conclusion
Given the rising wedge breakdown approaching the $ 1,603 support near the lower band of BB, the buyers would strive to defend their grounds. But ETH must find a close above the daily 50 EMA to ignite the chances of a robust rebound. The potential buying/selling targets would remain the same as discussed above.
Finally, investors/traders need to watch out for Bitcoin’s movement. This is because ETH shares an 88% 30-day correlation with the king coin.


