The following await MATIC after this latest breakout

Disclaimer: The findings of the following analysis are the sole opinions of the writer and should not be considered investment advice
Polygon’s [MATIC] recent bull run snapped the bounds of its 20 EMA (red) and the 50 EMA (cyan) to exhibit a buying edge. However, the $1-zone induced the selling resurgence to cause a pullback towards the $0.76 baseline.
The up-channel breakdown further reaffirmed the increasing selling vigor. A reliable jump below the existing support range could expose the coin to a near-term downside in the coming sessions.
At press time, MATIC was trading at $0.8058, up by 2.8% in the last 24 hours.
MATIC Daily Chart

The recent ascending channel (white) oscillation aided MATIC bulls to snap the three-month trendline resistance and flip it to support. Alas, the intersection of the 200 EMA (green) with the $1-mark created a stiff resistance for the alt’s growth.
Also, the recent hike in selling volumes depicted a robust bearish move below the near-term EMAs. An inability to close beyond the 50 EMA could propel a downside toward the $0.66-$0.67 range. The alt could also enter a potential compression in the $0.8-zone while trying to constrict its volatile break.
An eventual close above the $0.88-$0.93 range can provoke a rally towards the 200 EMA. The bulls were yet to ramp up the trading volumes to sustain a close above the immediate resistance range.
Rationale
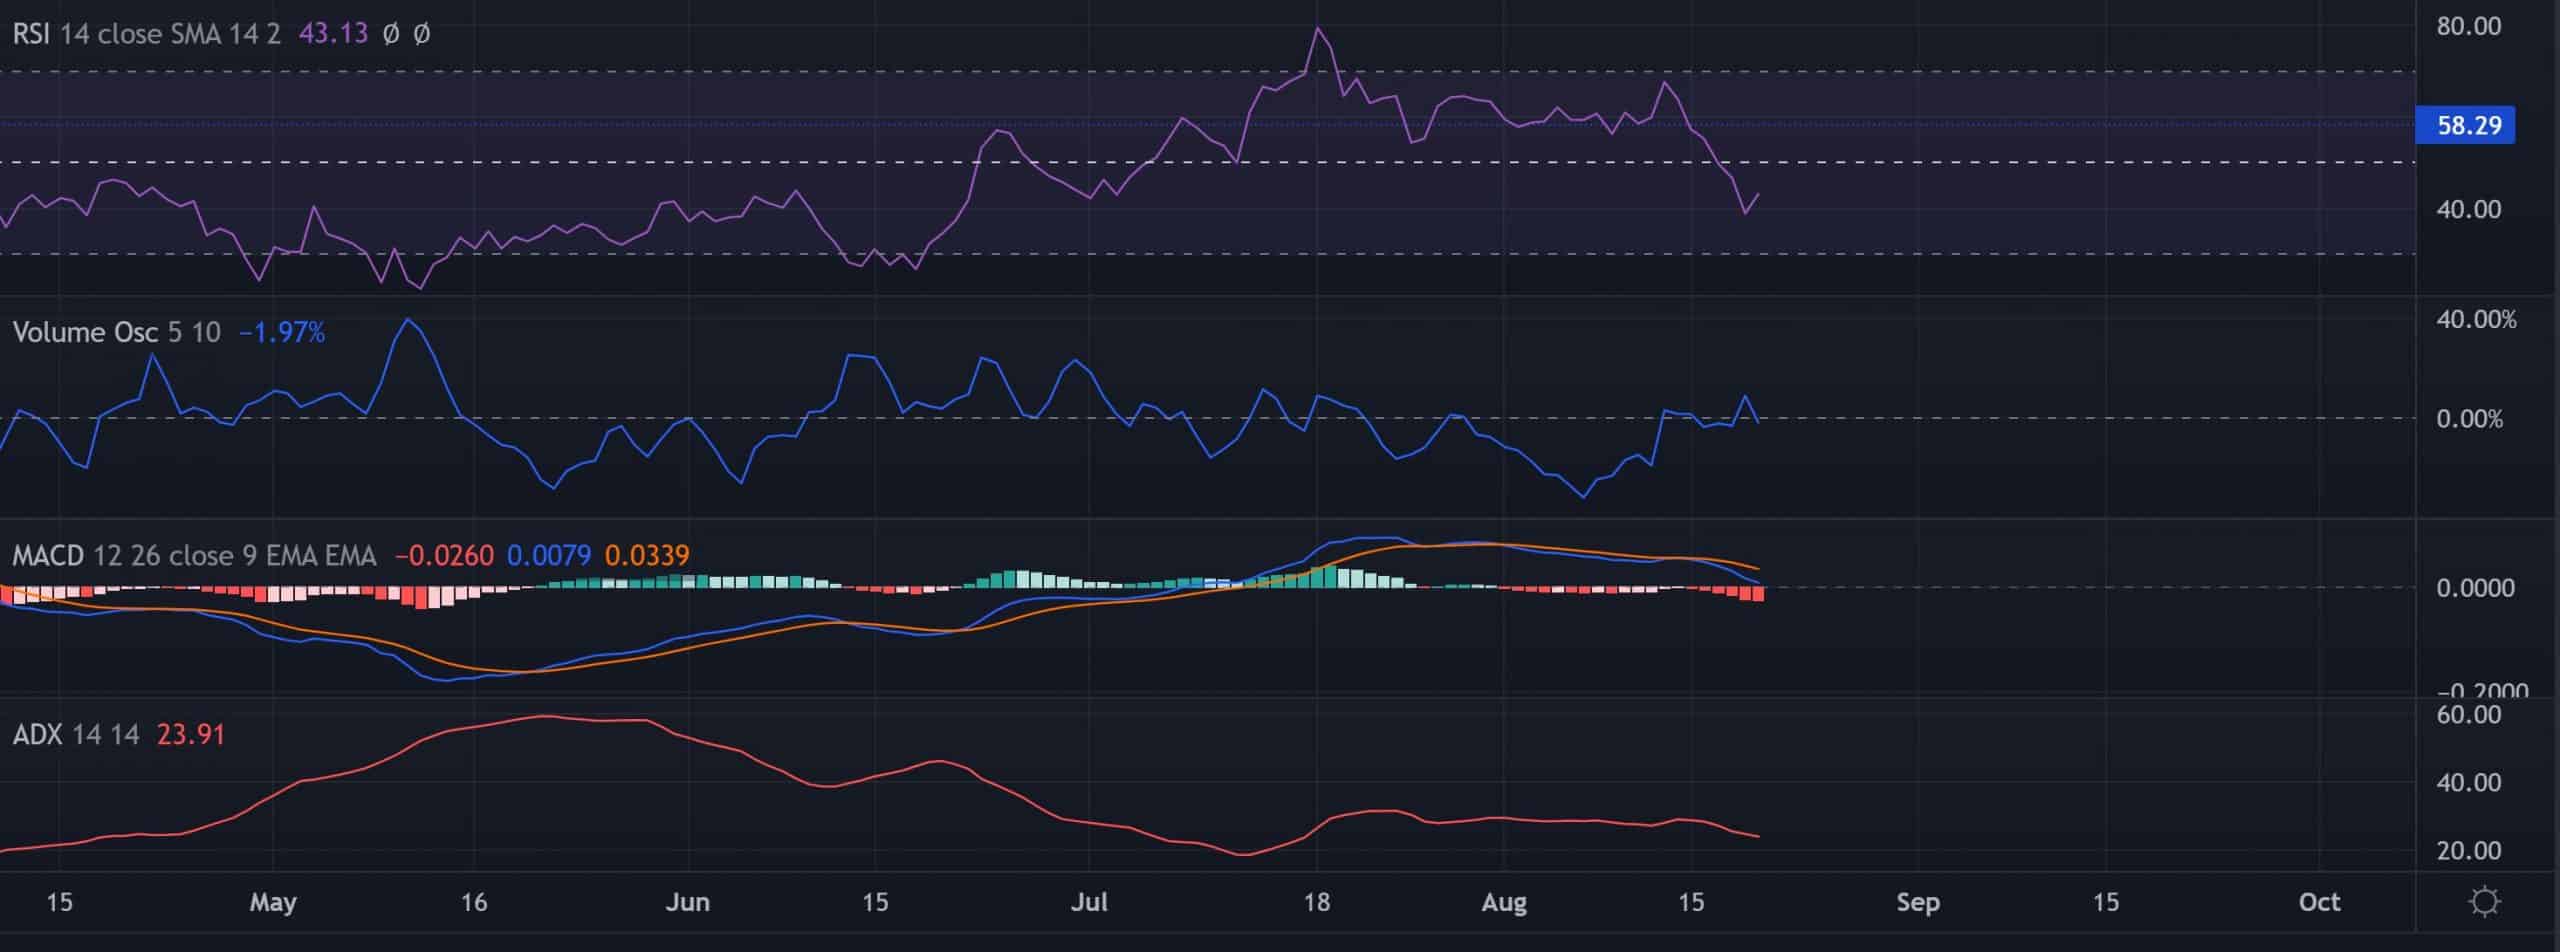
The Relative Strength Index (RSI) dipped below the midline to depict a slight selling edge. Furthermore, the Volume Oscillator’s higher peaks and troughs over the last two weeks confirmed the strength of the ongoing downtrend.
The MACD’s bearish crossover approached the zero mark on the indicator. Any drop below this level would confirm the press time bearish bias. Nevertheless, the ADX displayed a slightly weak directional trend for the alt.
Conclusion
MATIC’s decline below the EMA ribbons on greater volumes depicted a bearish advantage. The targets would remain the same as discussed. A consequent close above the near-term EMAs would confirm a bearish invalidation.
Finally, investors/traders must keep a close eye on Bitcoin’s movement as MATIC shares a 95% 30-day correlation with the king coin.