Ethereum, Shiba Inu, Terra Price Analysis: 12 January

As the broader sentiment improves, the king alt recovered from the 61.8% Fibonacci support and crossed its 4-hour 20-SMA.
On the other hand, Terra jumped above its 20-50-200 after clawing back to its 38.2% support level. Although Ethereum, Shiba Inu and Terra noted double-digit gains from their long-term supports, they needed to back it up with enough volumes to confirm a strong move.
Ether (ETH)
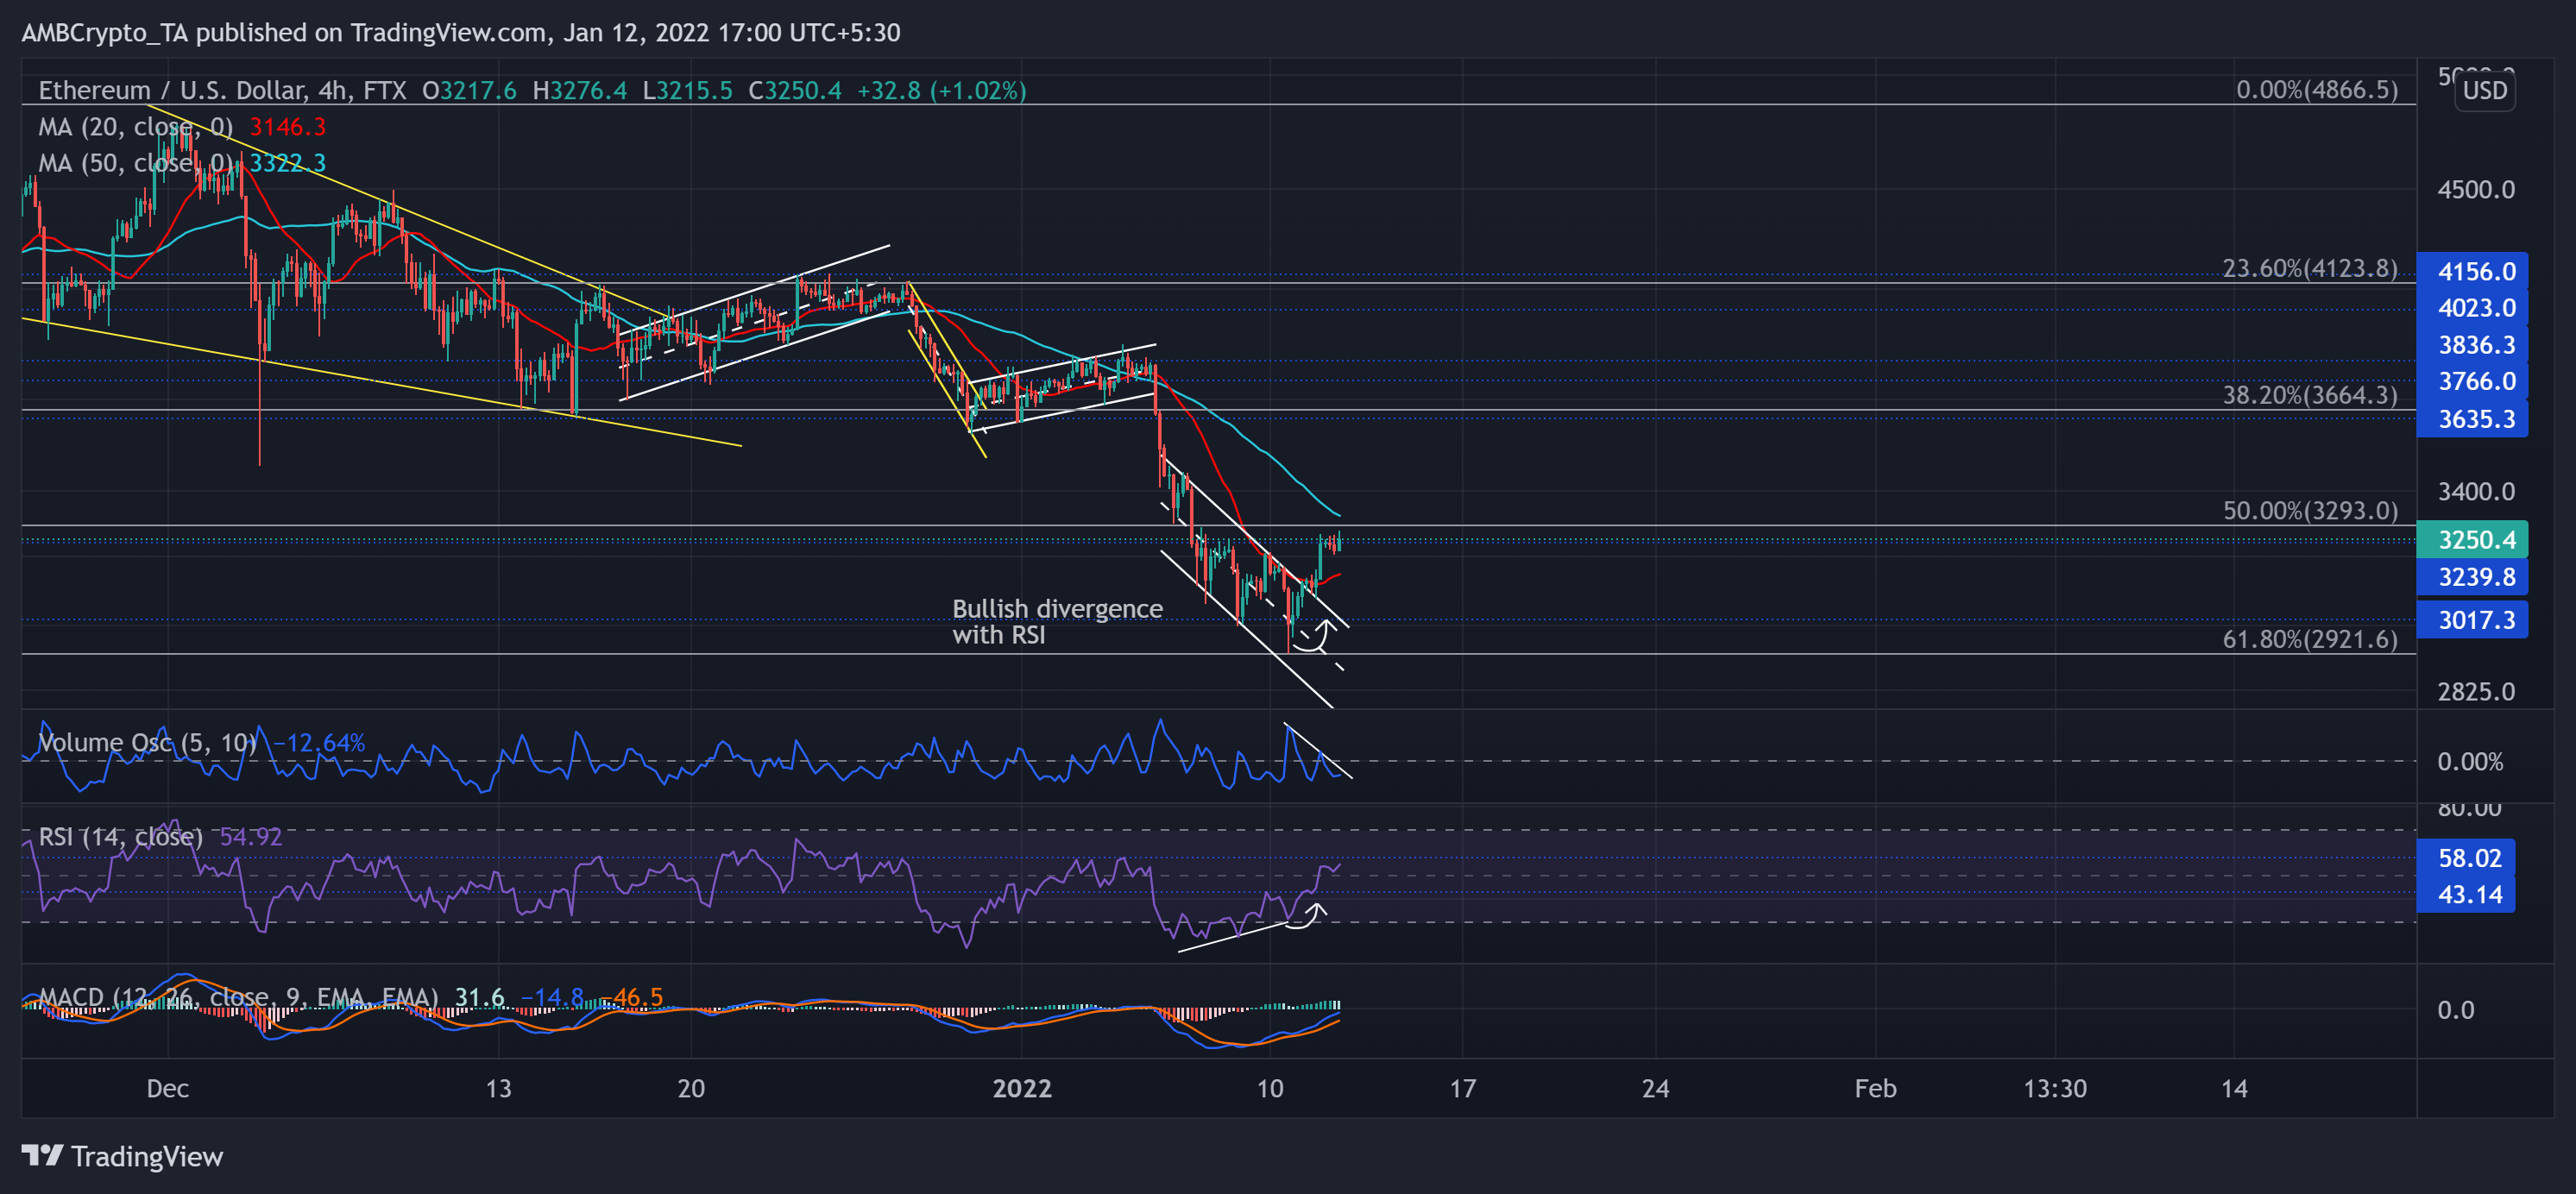
After poking its 15-week low on 10 January, ETH rebounded from the 61.8% Fibonacci support and grew by over 10.7% in the last two days. ETH upturned after the price bullishly diverged with the RSI.
Although the King alt was yet to reclaim the 50% support level, it found a close above the 20-SMA (red) and the $3,200 level. From here on, the next hurdle for ETH bulls stood at the 50-SMA (cyan).
It also becomes vital to take note of the lower peaks on the Volume Oscillator, indicating the weakness of recent gains.
At press time, the alt traded at $3,250.4. The RSI was in an uptrend and finally crossed the 43-mark over the past day. Now, it depicted bullishness and eyed to test the 58 point resistance. While MACD histogram displayed an increased buying influence, its lines remained below the equilibrium.
Shiba Inu (SHIB)
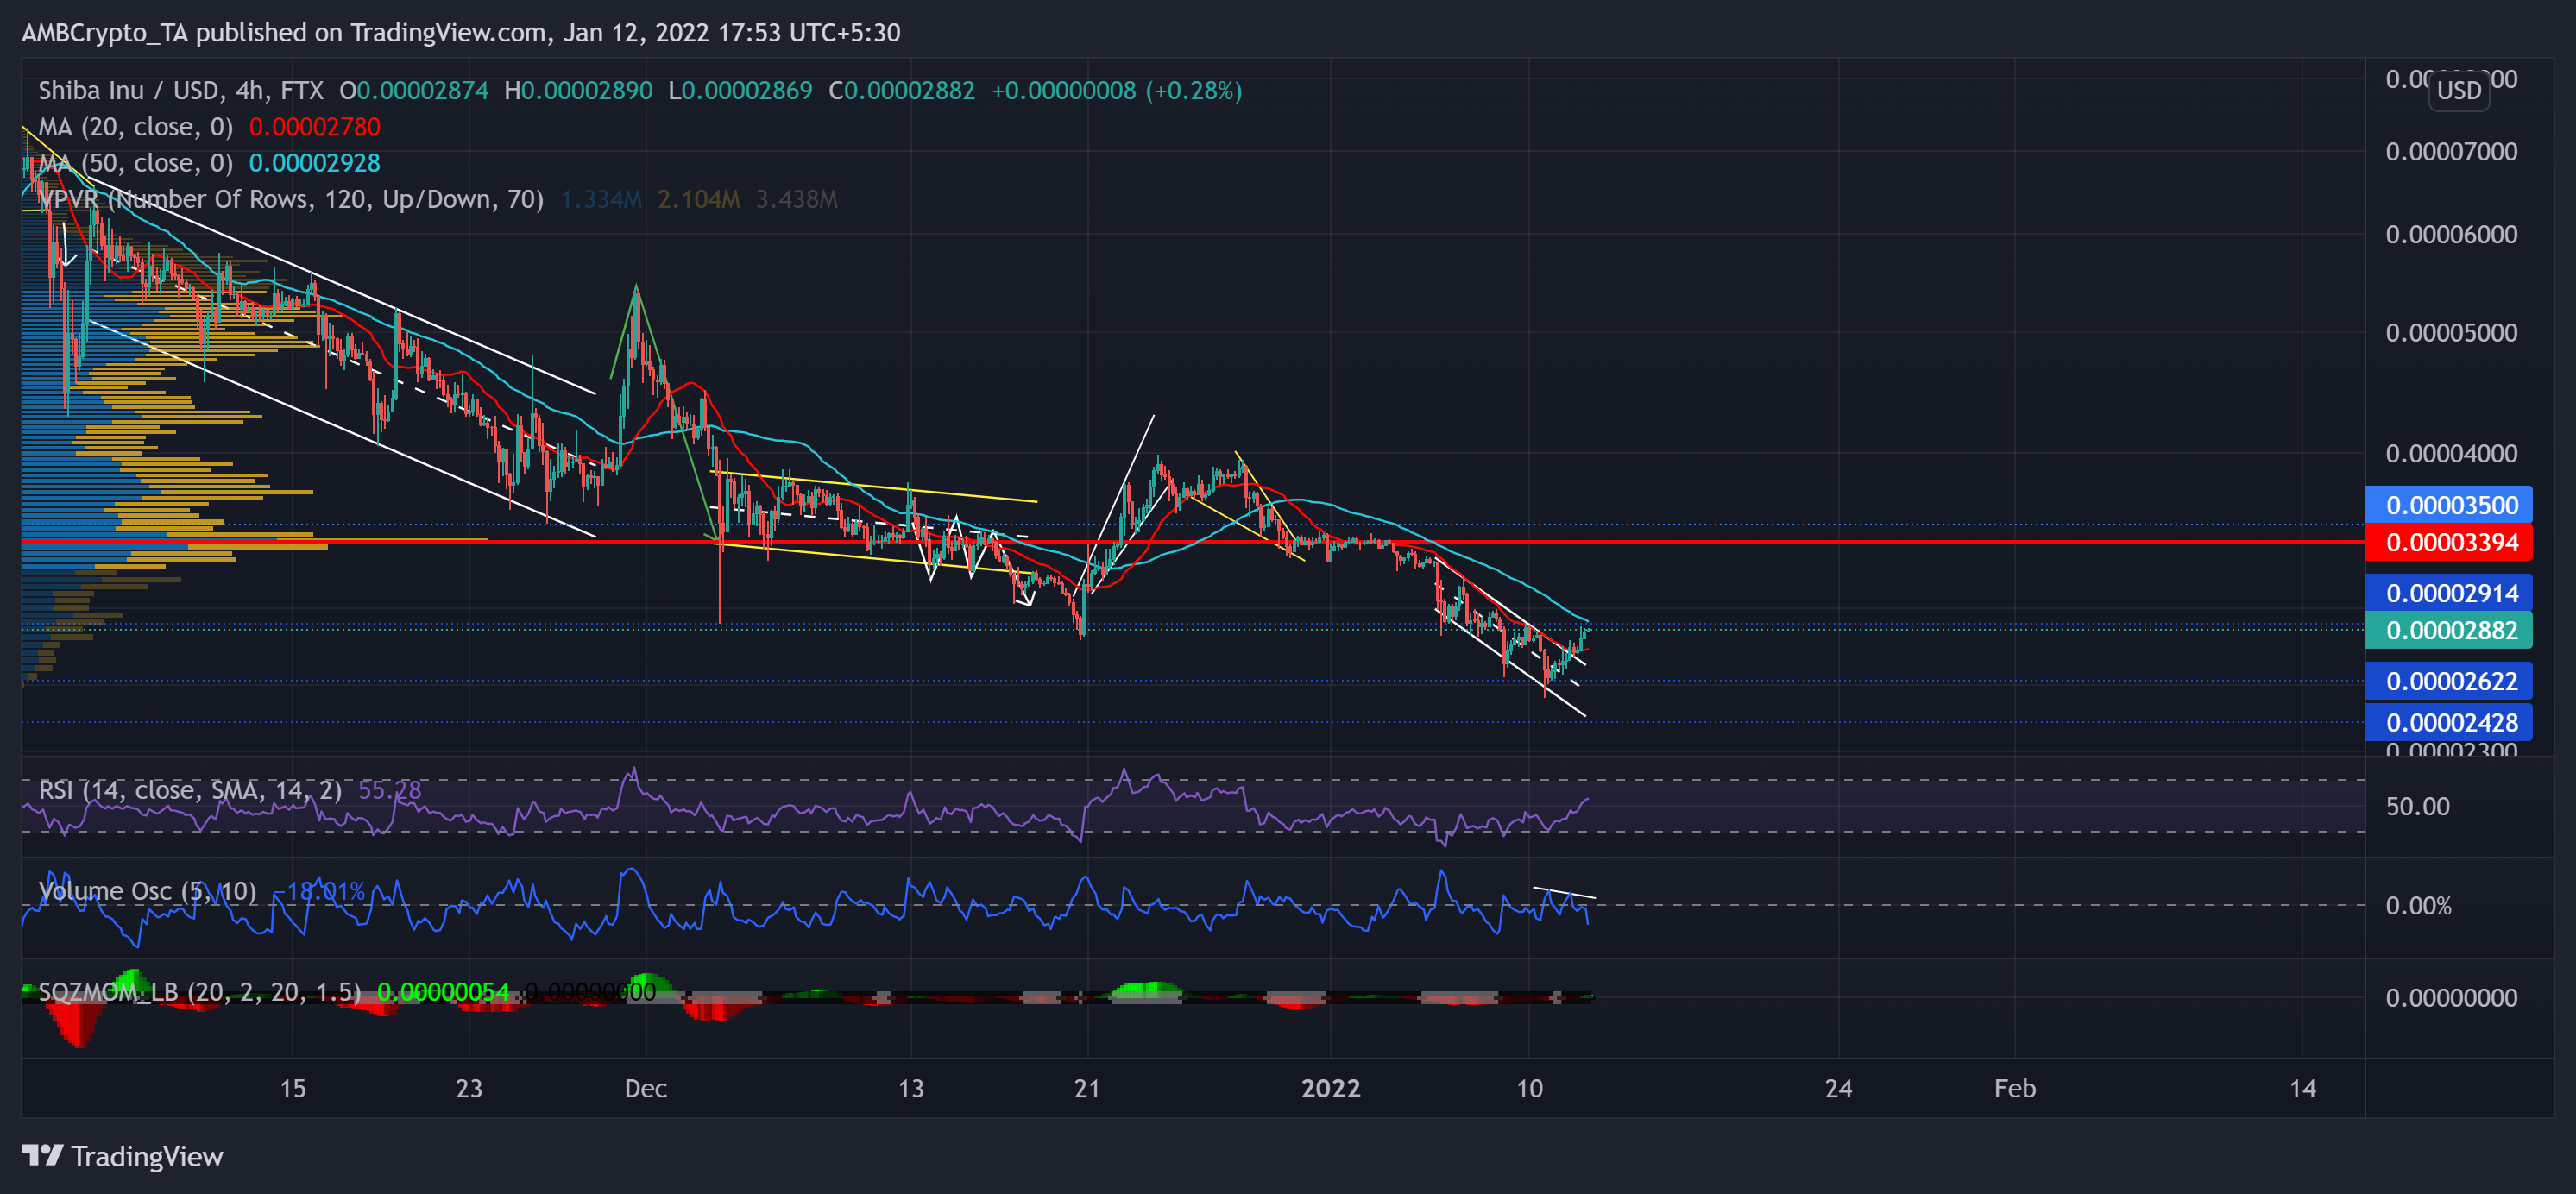
The recent falling wedge (yellow) breakout found it difficult to breach the $0.00003405-mark as the alt sought the highest liquidity near this area for nearly the past six months (Point of Control, red).
Over the past few days, SHIB oscillated between two parallel lines heading south (white) and poked its three-month low on 10 January. While ensuring the $0.00002622, bulls initiated a 10.9% two-day rally in an attempt to reclaim the crucial $0.000029114-mark.
At press time, the alt traded at $0.00002882. The RSI finally closed above the half-line and flashed a bullish preference. Interestingly, the Squeeze Momentum indicator hinted at a low volatility phase. Similar to ETH, the Volume Oscillator marked during the recent incline, hinting at a weak bullish move.
Terra (LUNA)
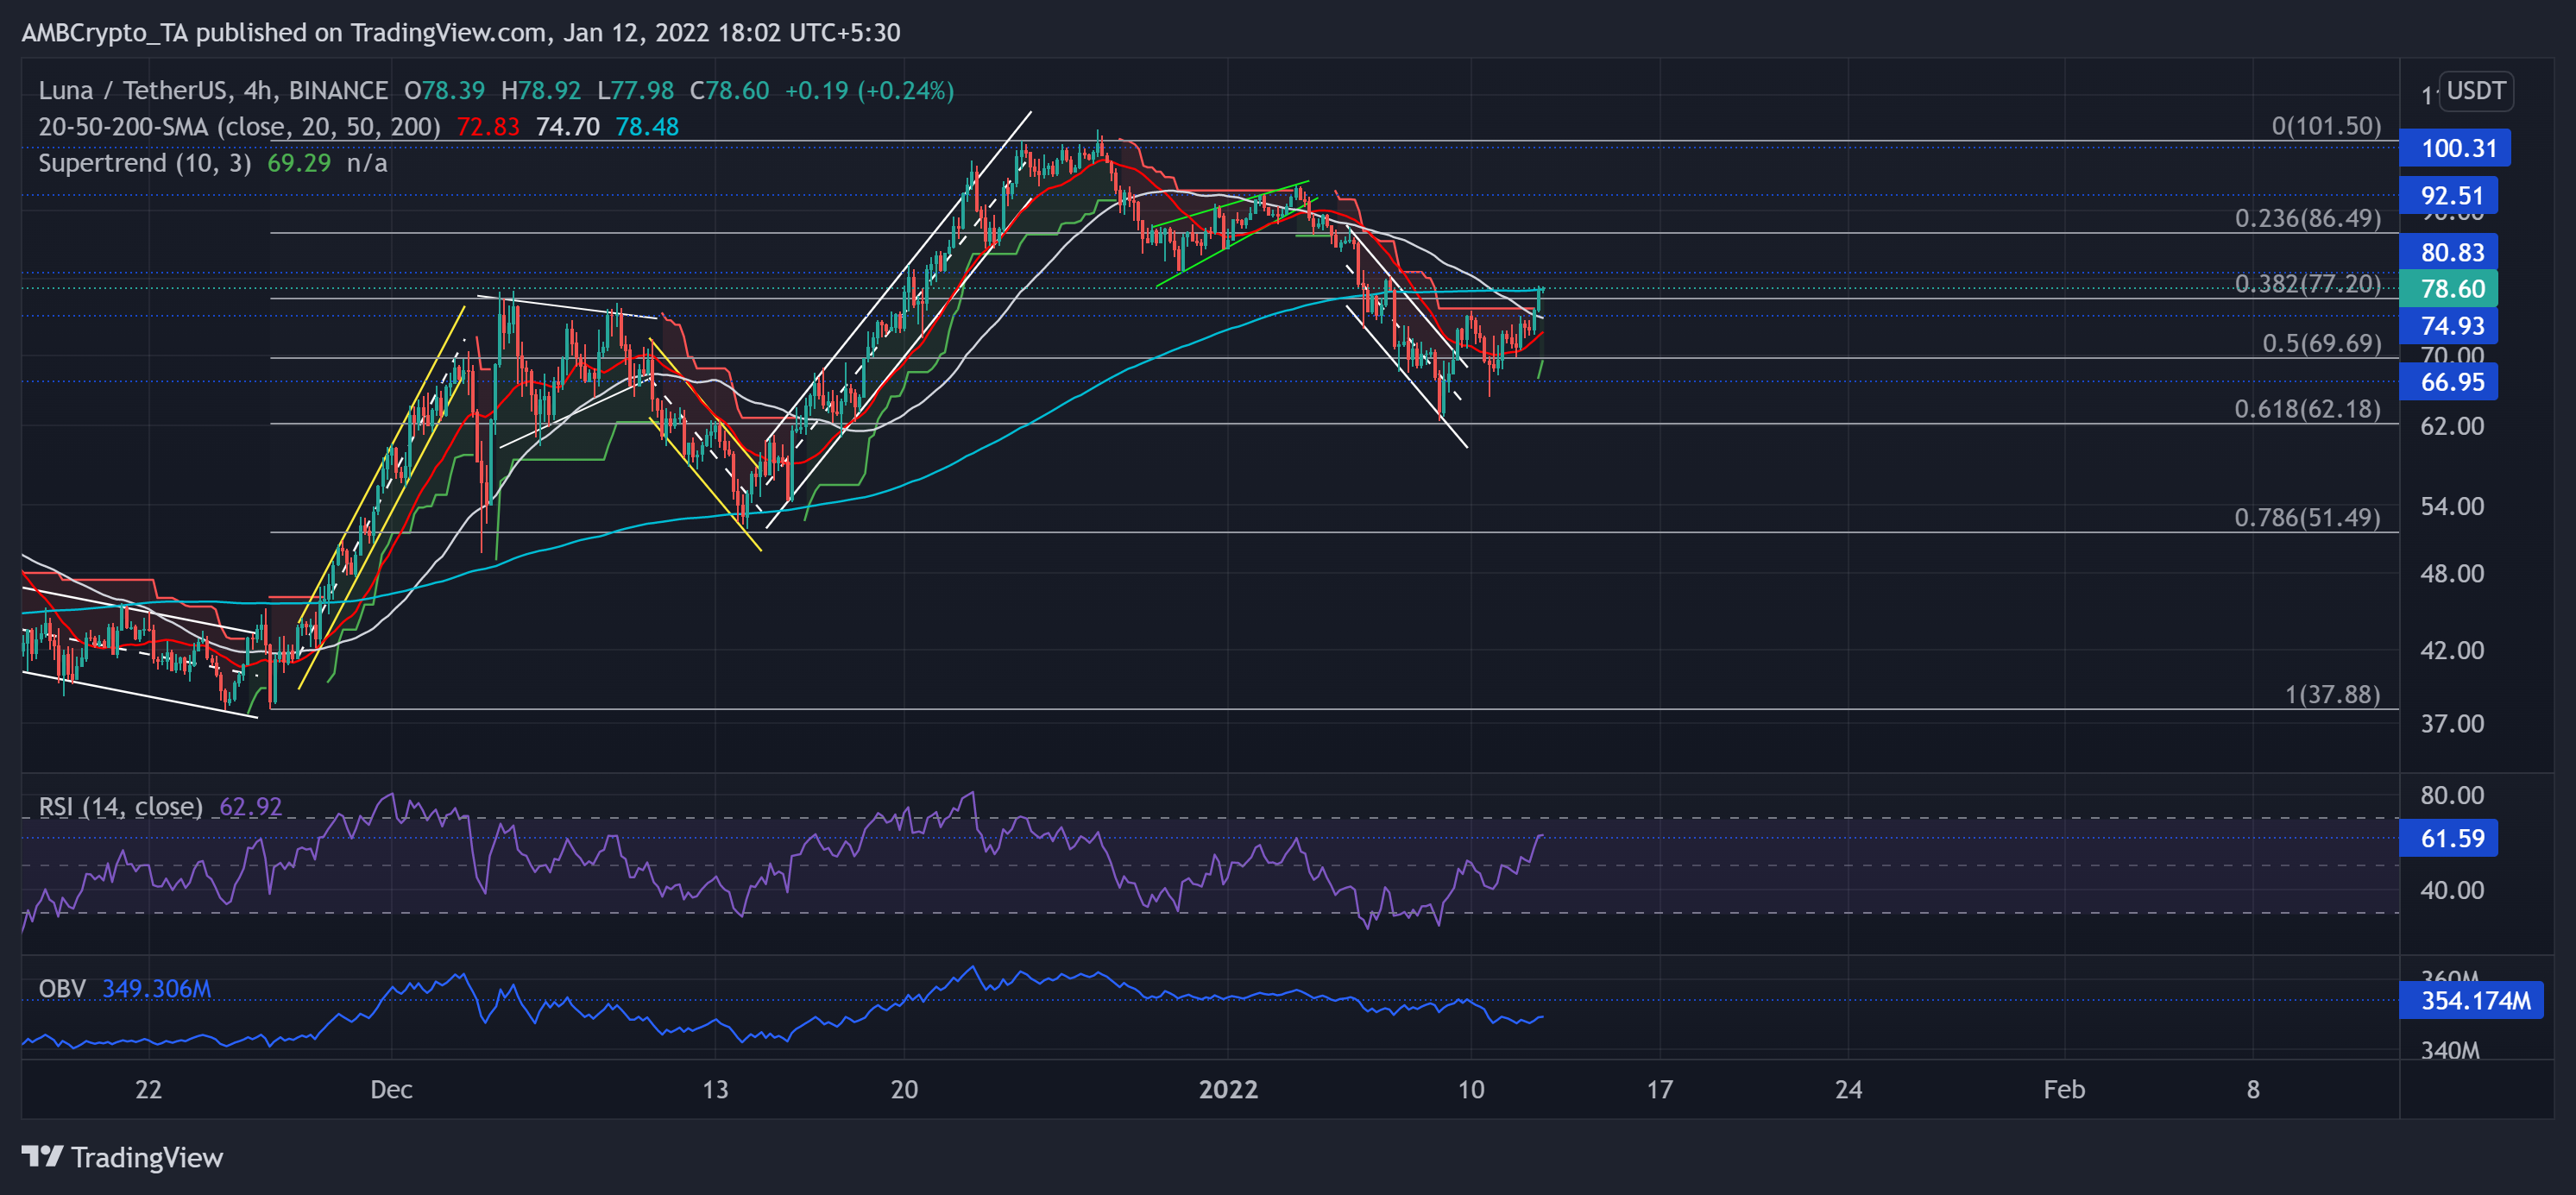
Since poking its three-week low on 8 January, the alt saw an impressive 24.11% recovery after rebounding from the 61.8% level.
LUNA regained the 50%, 38.2% support level and crossed the 4-hour 20-50-200 SMA. Now, the immediate testing point for the bulls stood at the $80.8-level. Any breakdowns would find testing support at the $74.9-level.
At press time, LUNA traded 24% below its ATH at $78.6. The RSI showed improvement signs after a sustained close above the midline. Meanwhile, the Supertrend finally flashed a green signal. However, the OBV failed to mark a corresponding spike with the recent hike, hinting at weak buying pressure.


