Cardano found buyers near the $1-mark, but here’s why that’s not enough

Disclaimer: The findings of the following analysis are the sole opinions of the writer and shouldn’t be considered investment advice
The price of Cardano has been falling over the past few months. The $1.2 support did not hold sellers at bay, however, the $1 area did. At the time of writing, Cardano appeared to be in the midst of an impulse move upward, a reaction from the $1 lows.
There remained a substantial amount of resistance still to overcome for the bulls, but a move toward $1.54 can be aided by Bitcoin’s bounce from its $40k lows.
Cardano 1-day chart
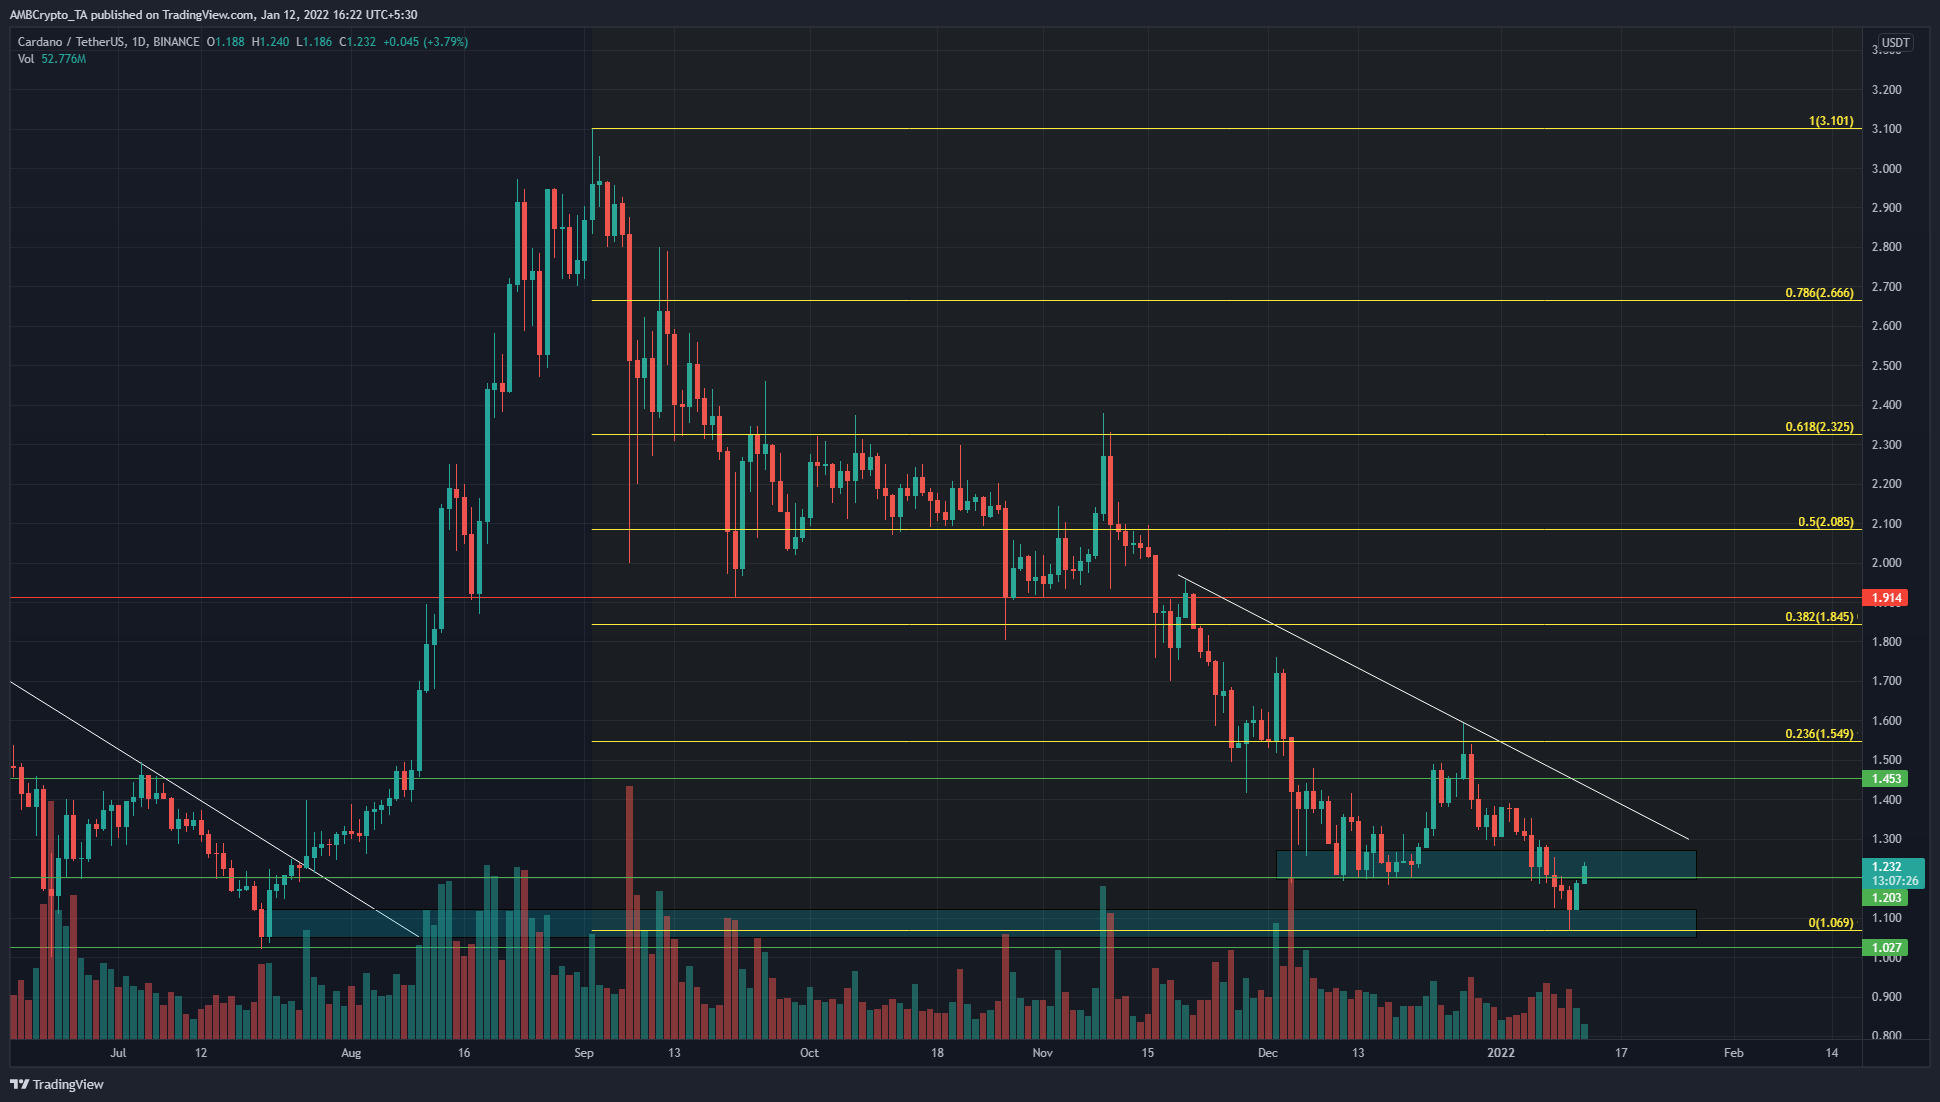
Using the move from $3.1 to $1.069 as the swing high and swing low, a set of Fibonacci retracement levels (yellow) were plotted. These levels showed the $1.54 level as the 23.6% retracement level. Moreover, a descending trendline from late November (white) could also offer resistance.
In July, ADA tested the $1.02 level of support and moved with strong momentum in the opposite direction in the next few days. This was an indication of strong buy orders in the $1 area. The price tested this area once more and has reacted positively thus far.
However, the downtrend has not completely waned. The S/R flip of the 23.6% level is one development more risk-averse investors can keep an eye out for. Hence, if ADA can move past $1.54, a retest of the same level can be bought.
Rationale

The Stochastic RSI climbed strongly in response to the price’s reaction near $1. However, the other indicators painted a more bearish outlook. The Awesome Oscillator was below the zero line, while the DMI also pictured a strong bearish trend in progress.
The CMF was also beneath -0.05 and it underlined that the direction of capital flow was out of the market.
Conclusion
While the indicators were strongly bearish, the $1 area has seen strong demand. At the time of writing, the price was within the $1.2 pocket. If ADA can flip this area from supply to demand on a daily timeframe, it would be a sign that ADA could be on its way toward $1.5.
However, the trading volume has not been exceptional and caution remained advisable. Just as the $1 area saw a bullish order block, the $1.45-$1.54 area could see a bearish order block develop.


