Ethereum, Shiba Inu, Terra Price Analysis: 18 January

While the bulls still could not alter the broader outlook, the global crypto market cap kept slackening. Consequently, Ethereum and Shiba Inu’s RSI saw confirmed double-top after a sharp plunge below their supports. However, Ethereum’s CMF bullishly diverged with its price.
Shiba Inu also saw an oversold position, but its OBV seemed hopeful for the investors/traders.
Ether (ETH)
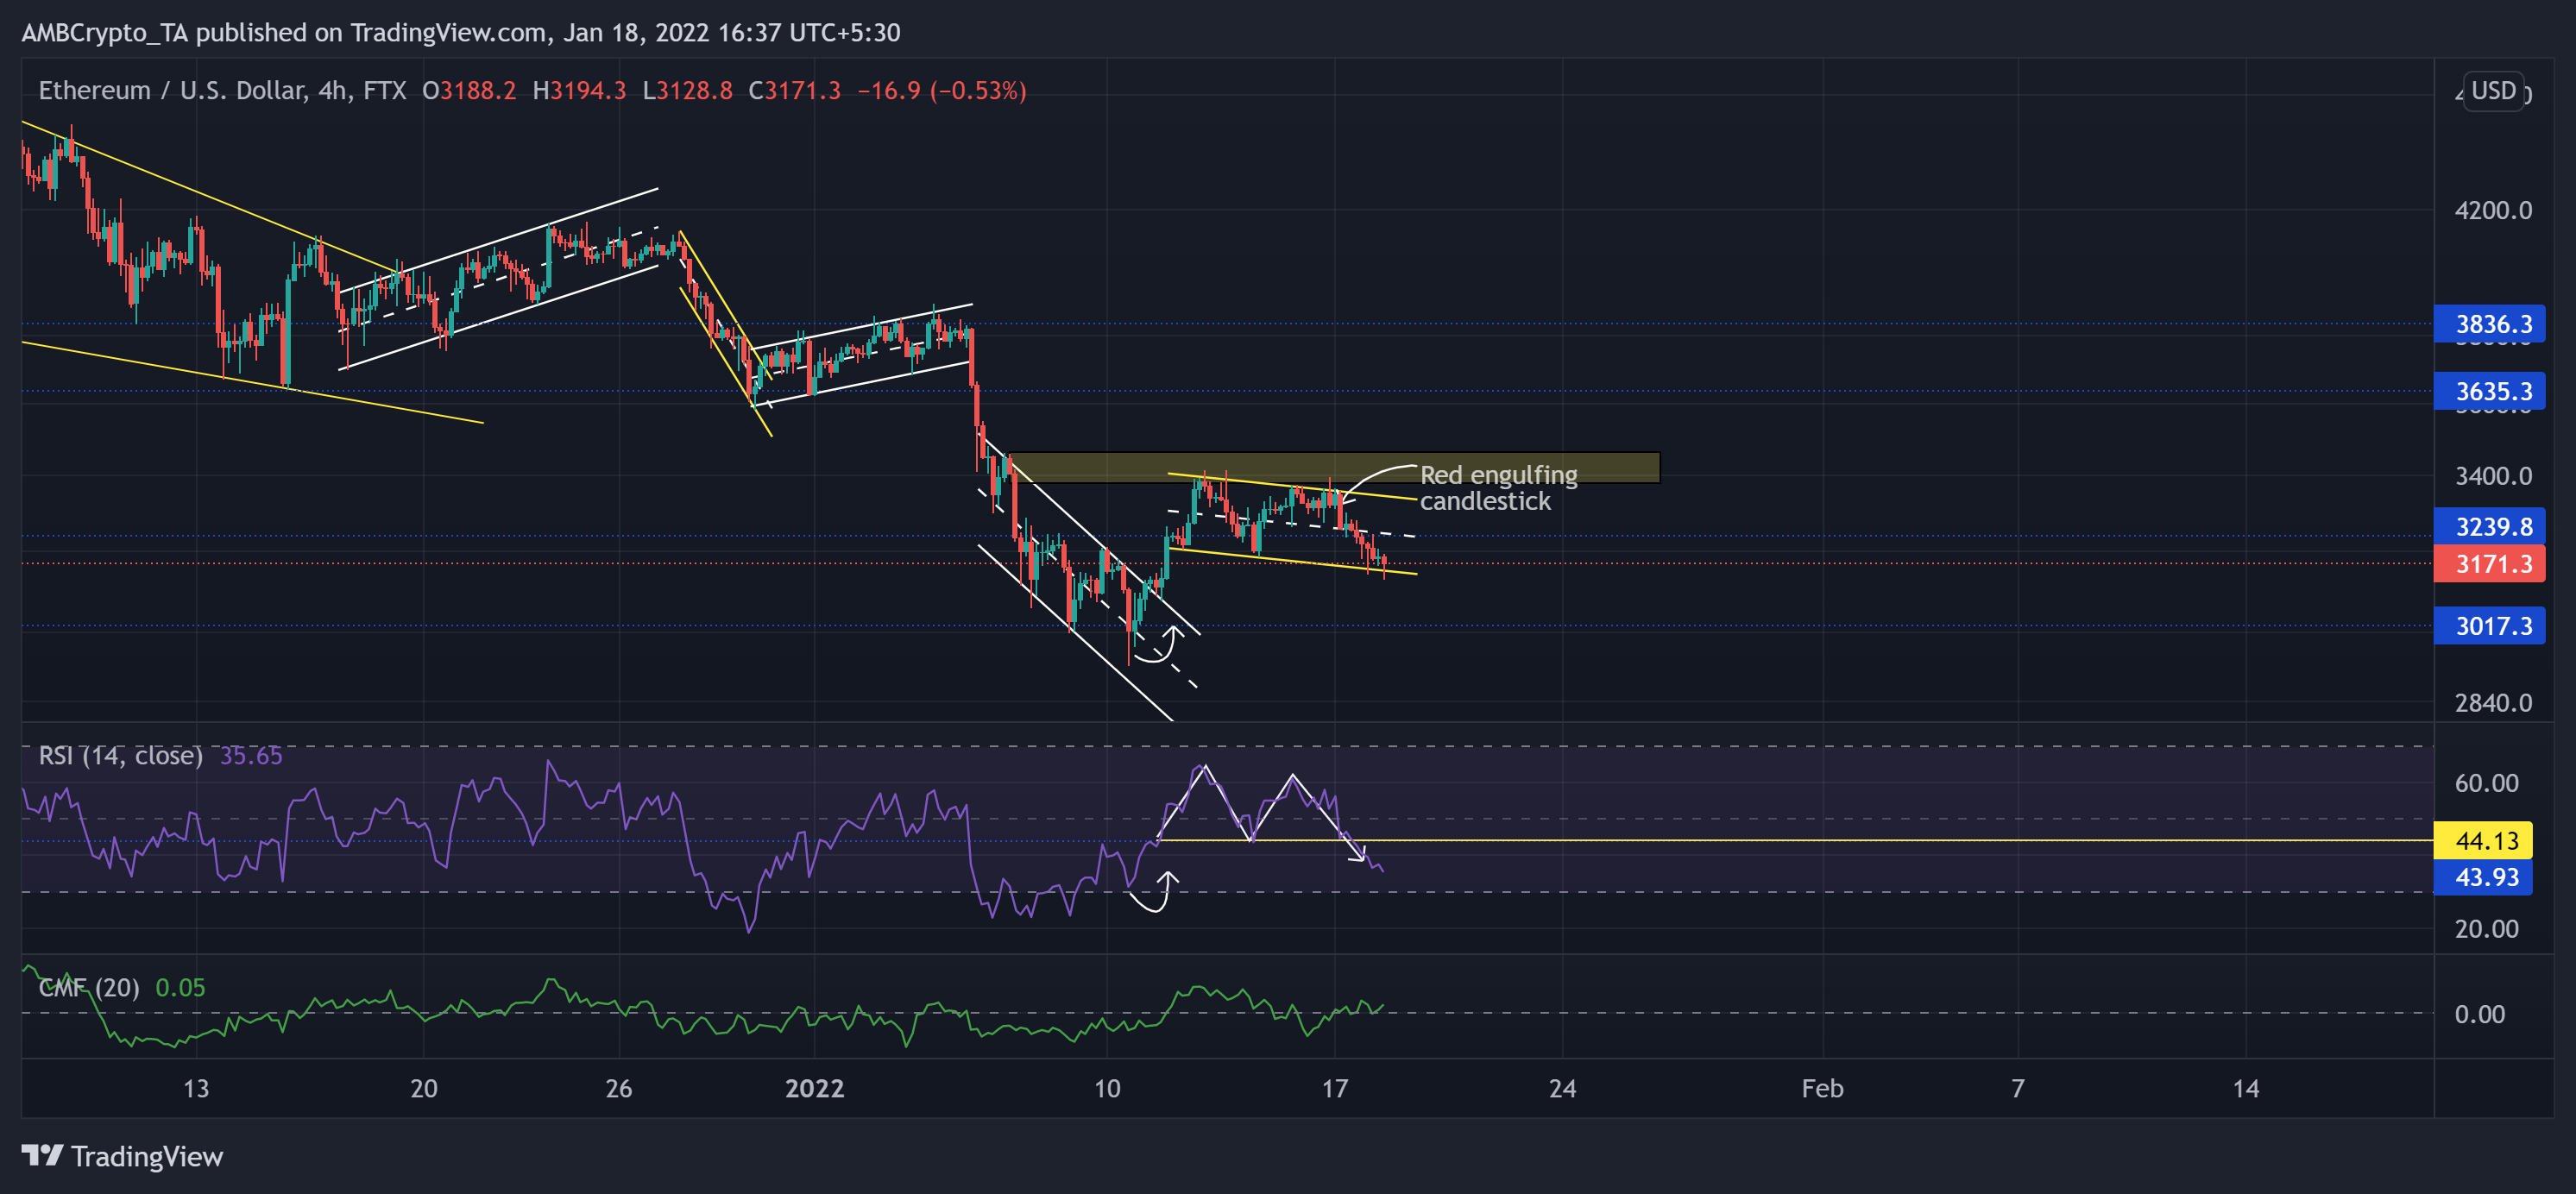
The bearish rally finally seemed to stall after the alt bounced back from its long-term support at the $3,000-level. After poking its 15-week low on 10 January, the king alt grew by nearly 17% but saw a pullback from its immediate supply zone (rectangle, yellow).
The altcoin witnessed multiple red candlesticks over the past day after a big engulfing stick on 17 January. As the buyers failed to step in, bulls flipped the $3,239.8-mark from support to resistance.
At press time, the alt traded at $3,171.3. After the RSI fell below the 44-level, it confirmed the Double-top pattern on its 4-hour chart. Thus, it flashed weak signs as it plunged toward the oversold mark. Interestingly, the CMF was in an uptrend and bullishly diverged with the price action. This reading reignites a bullish comeback possibility.
Shiba Inu (SHIB)

The recent falling wedge (yellow) breakout found it difficult to breach the $0.00003411-mark as the 61.8% Fibonacci resistance stood strong. Although the bulls strove hard, the 5 January sell-off saw an over 22% retracement until SHIB poked its three-month low on 10 January.
Then, the meme token saw an exceptional rally and recovered its previous losses, but the 50% resistance stood strong. Over the last six days, the alt was down by over 16%. The immediate testing point for the bulls stood at the 38.2% level.
At press time, the alt traded at $0.00002796. The RSI poked the oversold region and confirmed a one-sided bearish vigor. However, it becomes vital to note that the OBV did not correspond with the recent fall, hinting at a possible bullish comeback.
Terra (LUNA)
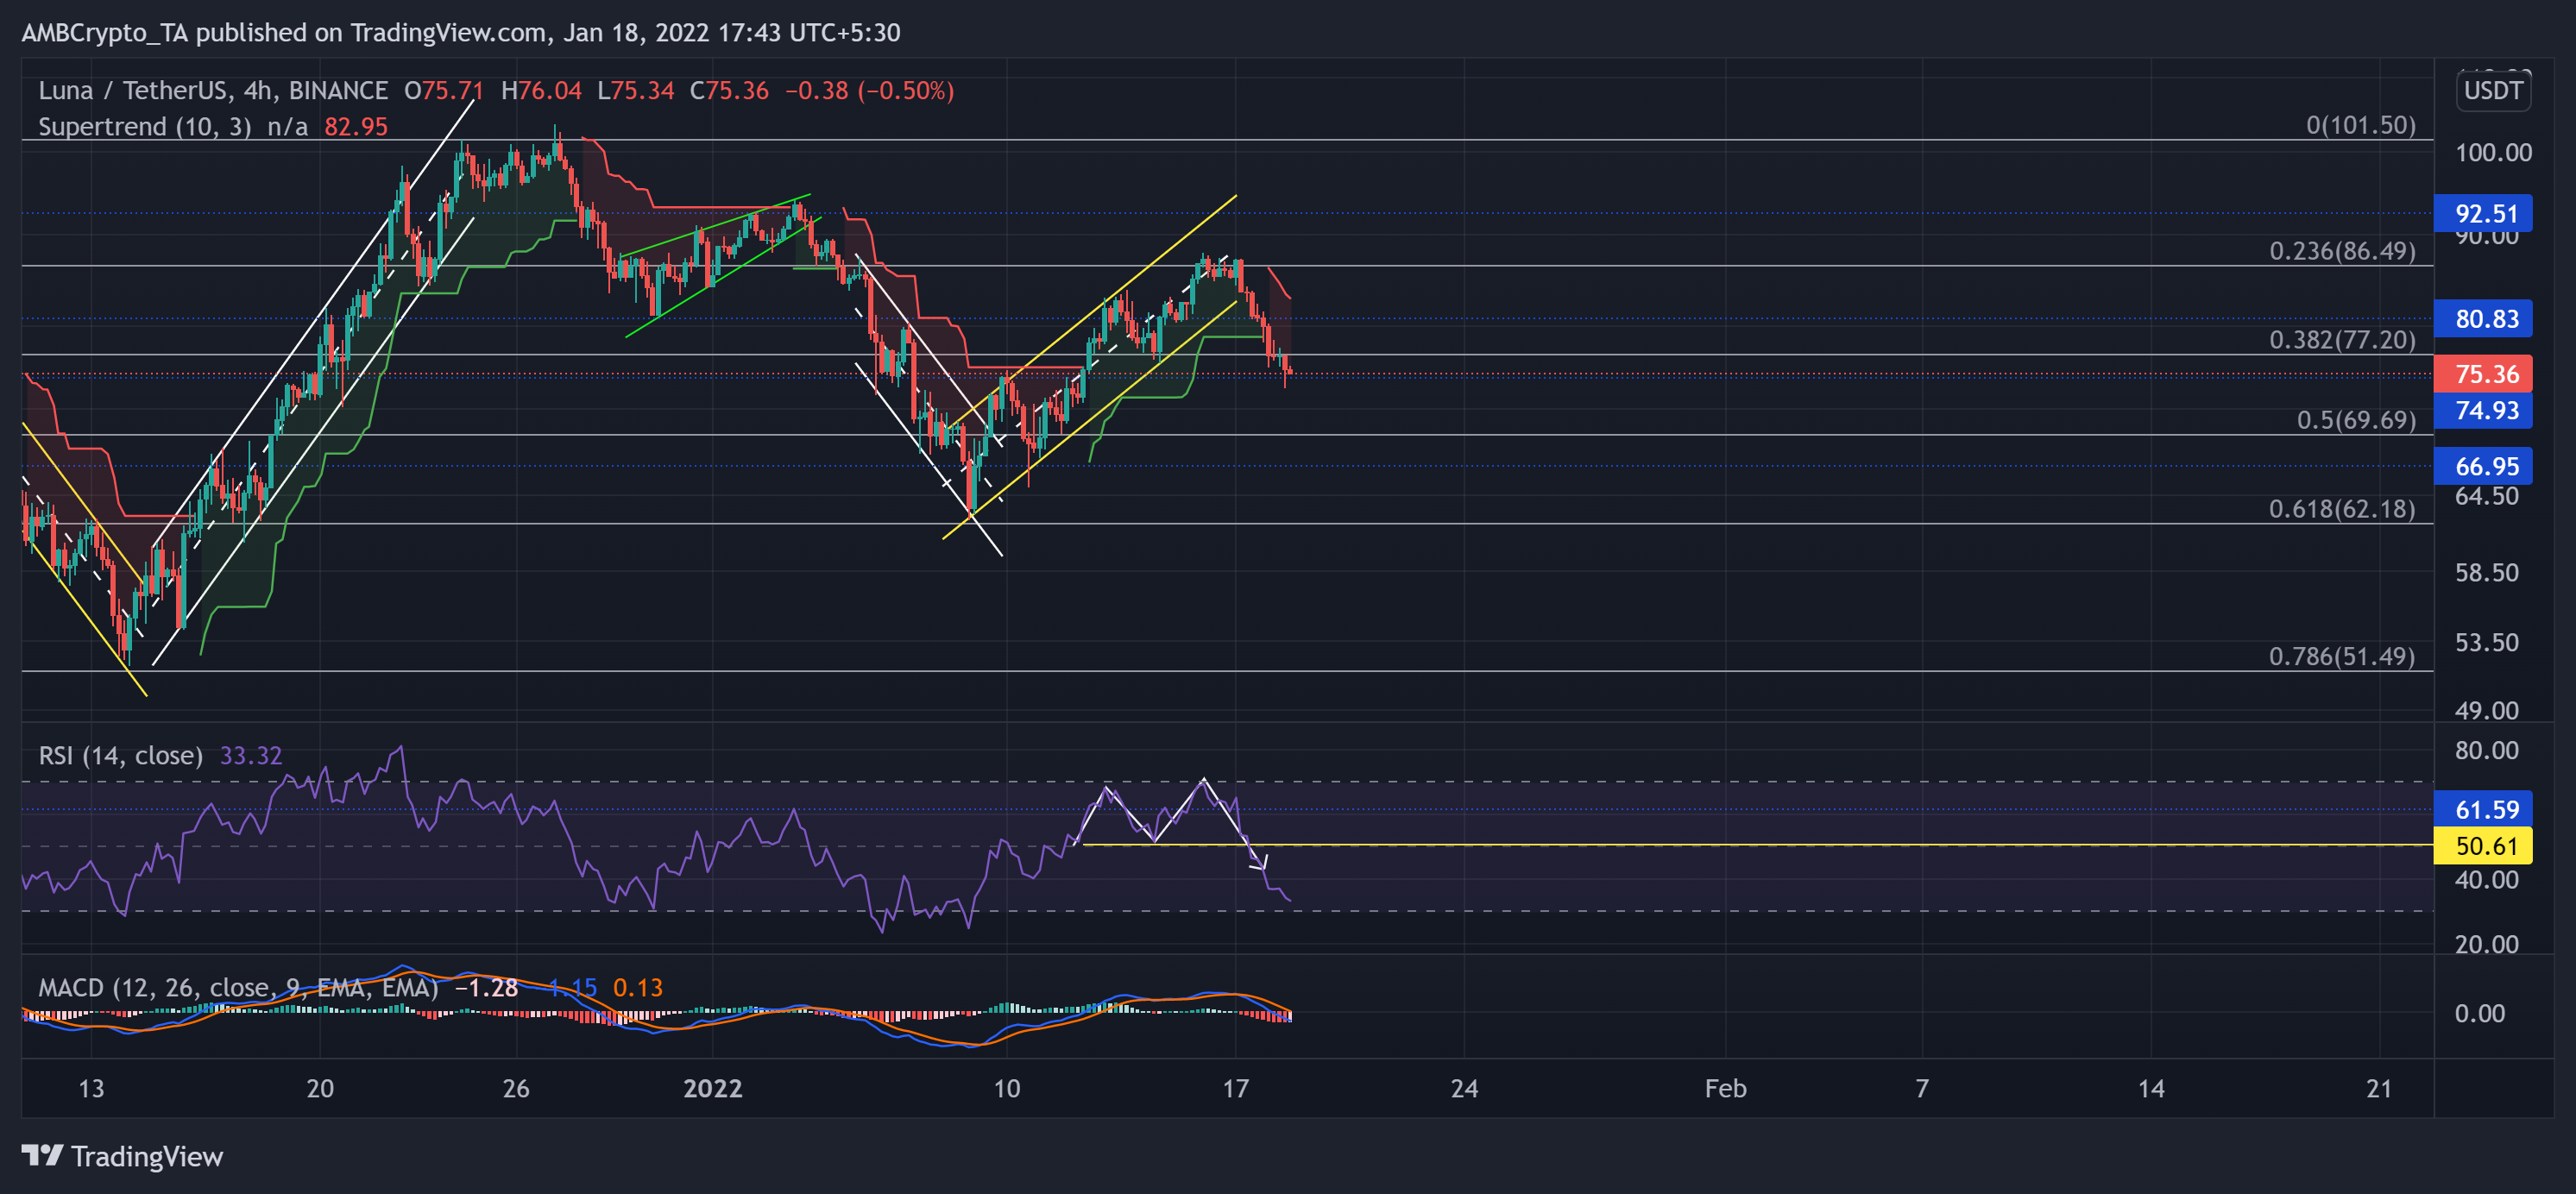
Since poking its three-week low on 8 January, the alt saw an impressive 39.6% recovery after rebounding from the 61.8% level. However, the $86-level resistance stood strong as the alt saw an up-channel (yellow) breakdown. Accordingly, LUNA lost the 38.2% support level.
Now, the testing point for the bears stood at the $74-level. Any reversals would find resistance near the $77-mark. At press time, LUNA traded at $75.36.
The RSI saw a steep decline below the half-line after forming a double-top for the last six days. Also, the Supertrend now flashed a red signal. Also, the MACD lined dip below the equilibrium, hinting at increased selling pressure.


