Ethereum, Solana, Litecoin Price Analysis: 21 June

Growing market volatility could be noticed as altcoins like ETH, SOL, and Litecoin failed to defend their support marks even after experiencing slight price recoveries over the past day. Bitcoin’s trading volume jumped 50.89% even as it lost over 6% of its market cap. Similarly, the altcoins experienced higher trading volumes as selling pressure and capital outflows increased. ETH could show reversals in the coming days due to positive bullish momentum, however, SOL could be headed for a further price reduction.
Ethereum [ETH] –
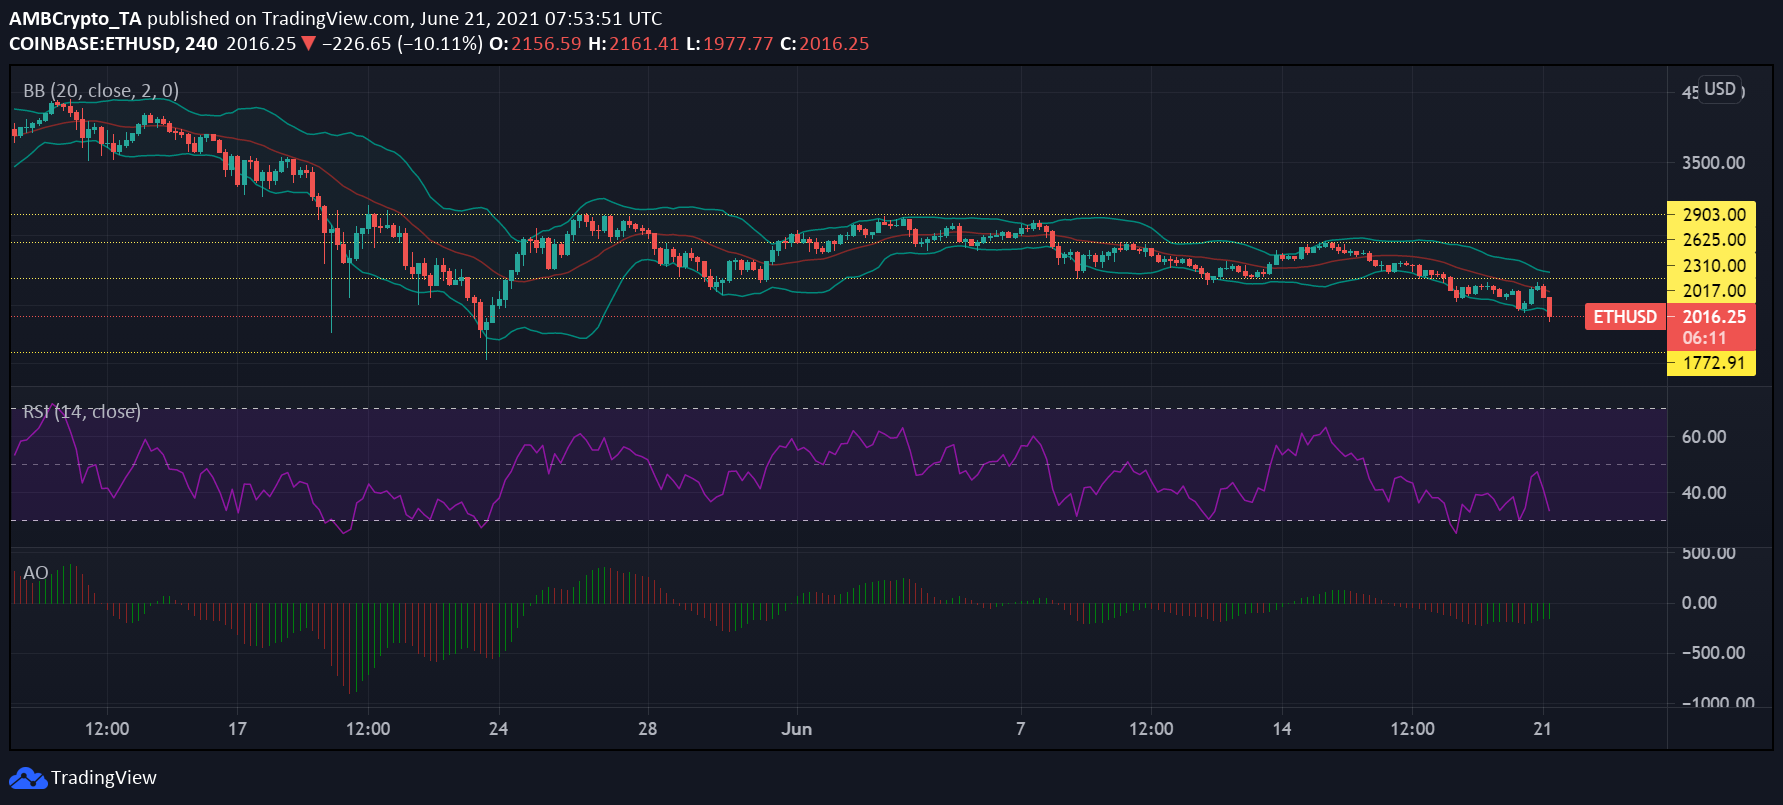
The 2nd highest-rated coin, Ether broke through the $2017 support at the time of writing. It lost 8.6% of its valuation over the past day, and 19% over the week.
Relative Strength Index (RSI) was at 33 at the time of writing, heading for the oversold zone as sellers continued to dominate the market since 16 June. If the indicator crosses the 30-mark, it may trigger a price reversal going forward.
The divergence of Bollinger Bands highlighted market volatility and price action could be sharp going forward. However, Awesome Oscillator showed that bullish momentum was building up.
Although the bears dominated the coin’s price movement, a reversal could be expected later due to the buildup of bullish momentum.
Solana [SOL] –
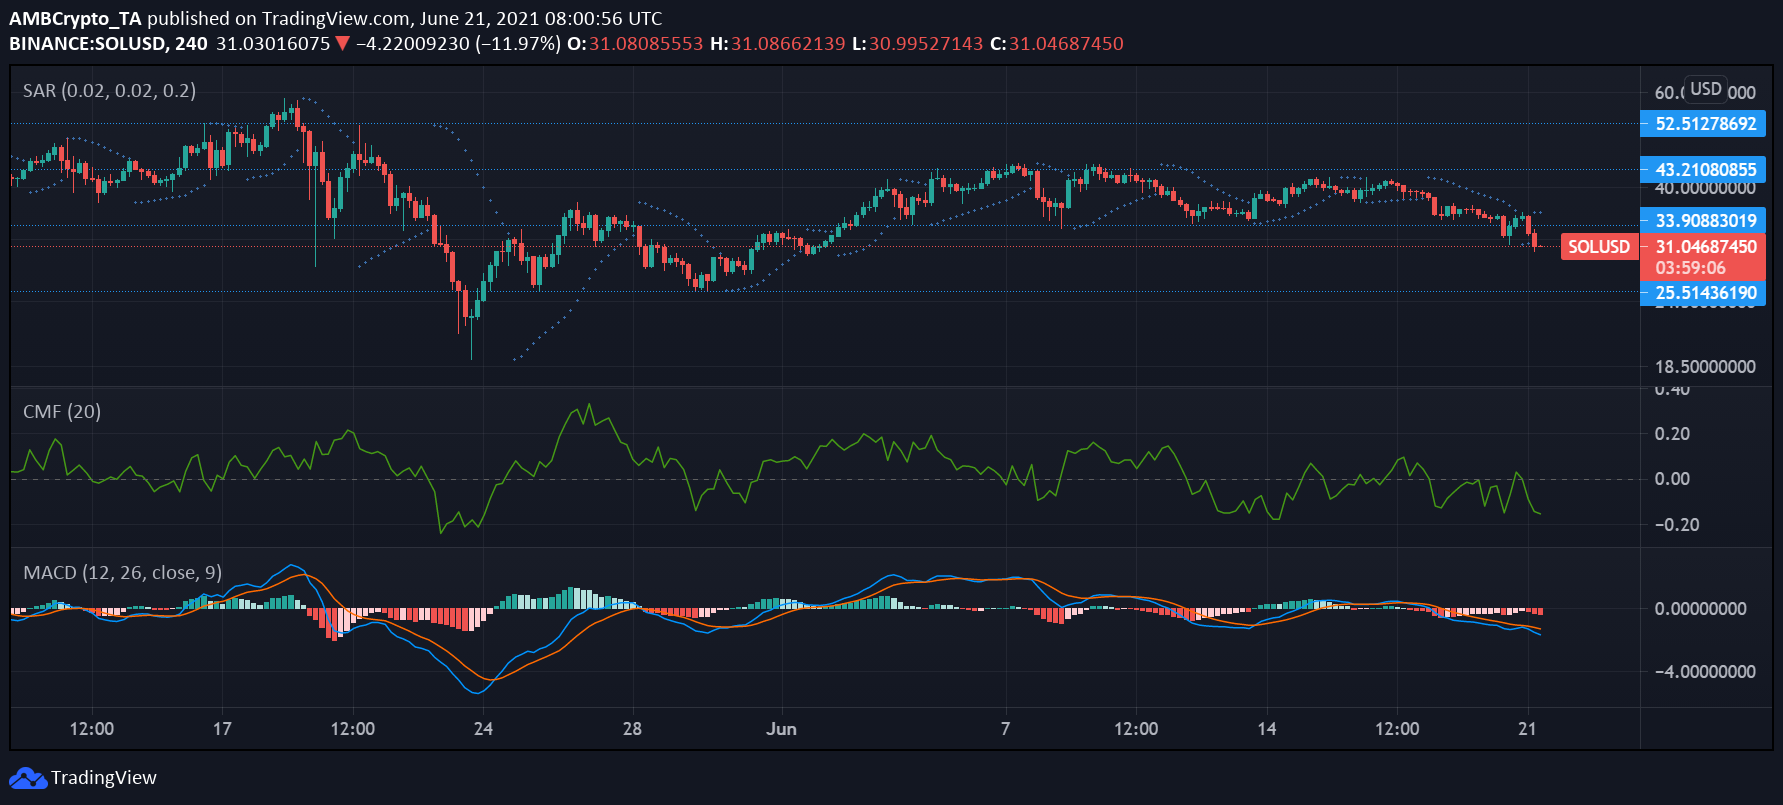
SOL was trading at $31 at the time of writing, after dipping by 12% over the past day. It dropped down from its $33.9 support mark yesterday, and after a brief recovery, continued moving in a downward direction. In the past week, its short-term ROI was reduced by 20.19%.
MACD lines experienced a bearish crossover on 17 June, and they began to diverge below the histogram last night. After changing sides for a few hours, Parabolic SAR’s dotted line began hovering above the candlesticks again, as the asset’s price movement followed a bearish trend.
Chaikin Money Flow attempted to break through the equilibrium around the same time but fell back down to the bottom as capital outflows preceded inflows.
If the downward trend is sustained by SOL, it could see an 18% price change to its May low of $25.5.
Litecoin [LTC] –
Litecoin breached the $144.5 support, even as it made a slight recovery and then fell back down over the day. Overall, at the time of writing, it had a 1-day price drop of 9.1% but its 24-hour trading volume increased by 26.93%.
Relative Strength Index (RSI)‘s movement began a downward trend on the previous night, and at press time was noted just above the oversold zone. Sellers continued to dominate the market as the indicator had failed to cross the equilibrium since 17 June. Although, bearish pressure could be reactionary before the asset heads toward price stability.
Awesome Oscillator pictured that bearish momentum was building up. The divergence of Bollinger Bands pointed towards a volatile market and price movement could be steep going forward.
If LTC is able to reverse its price action, it could break through $157 and start consolidating.


