Ethereum, Solana, MATIC Price Analysis: 17 June

Total market capitalization rose by almost 3 percent within the last 24 hours after losing $108 billion between June 15 & 16. Ethereum gained some limelight after Goldman Sachs announced their plans to expand into Ether alongside Bitcoin. Solana was in the news for leading PARSIQ’s $3 million funding. MATIC gained a lot of fans after Mark Cuban declared that “MATIC is destroying everything else” at the DeFi Summit.
Ethereum [ ETH ]:-
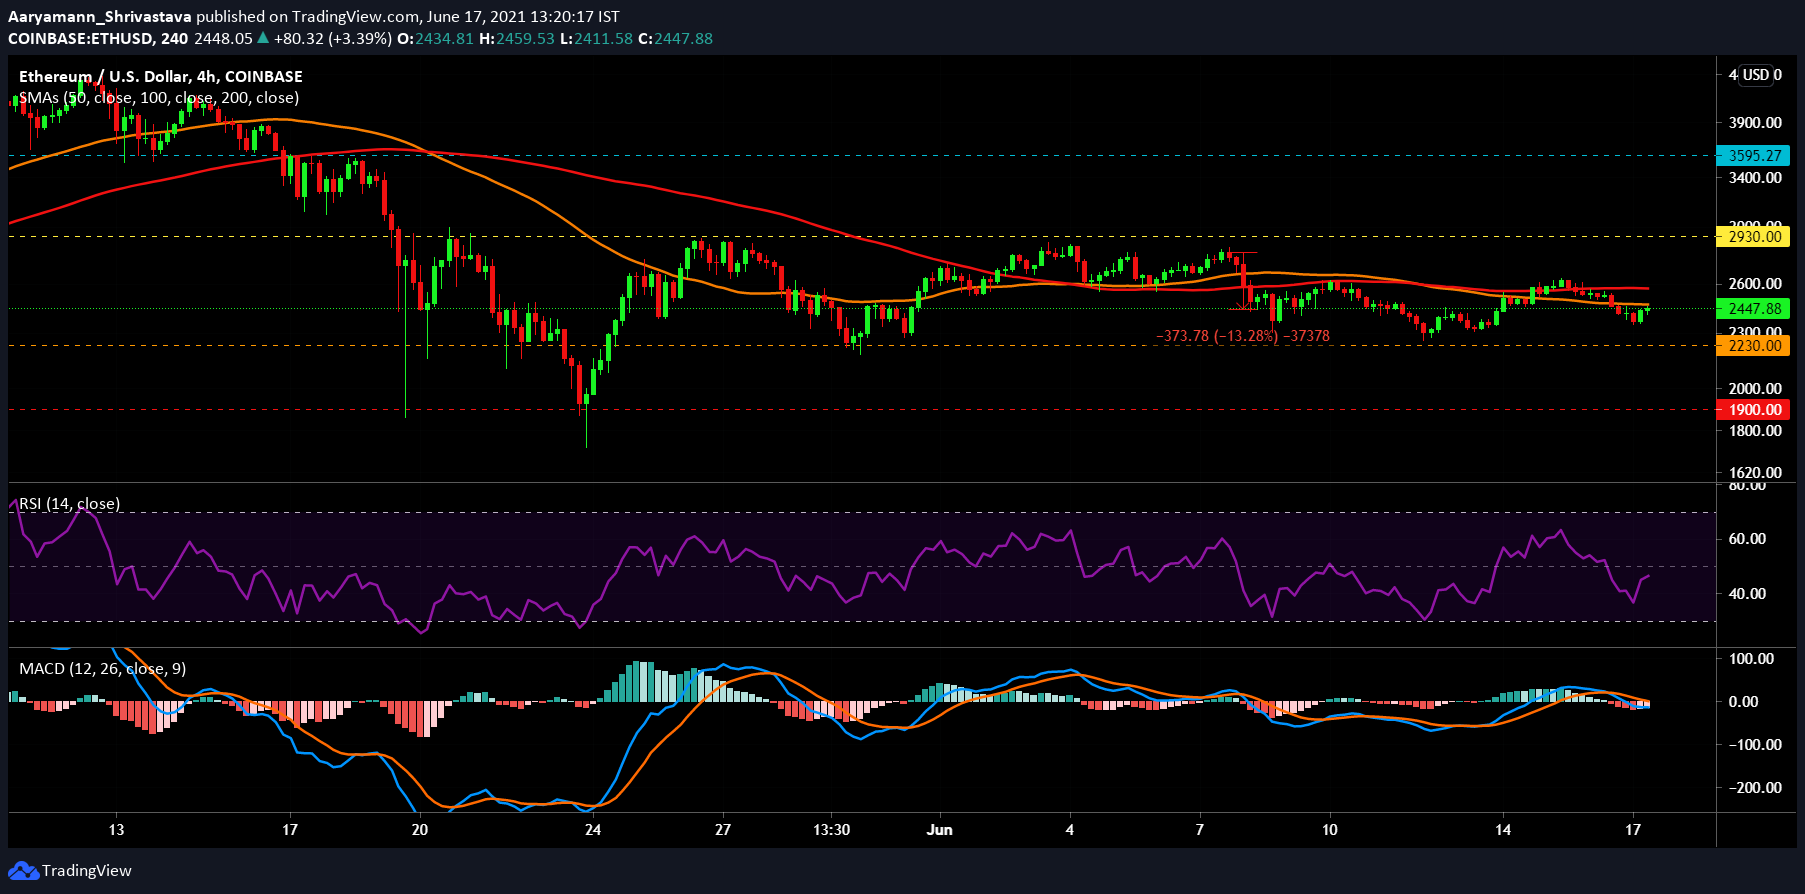
Ethereum did not respond as well as expected during the June 13 rally as the coin failed to recover the June 8 drop where it lost 13.2% of its price. The coin kept above the $2230 support level and traded at $2447 at the time of writing. Both Simple Moving Averages lines – 50 SMA (orange) and 100 SMA (red) remained bearish as the lines kept above the candlesticks.
MACD continued to exhibit a bearish crossover as the red signal line moved over the blue indicator line. On the other hand, the Relative Strength Index (RSI) was saved from falling into the oversold zone. The purple line rose toward the bearish neutral territory at 46.4
$2930 and $2230 are very strong resistance and support levels as ETH did not fracture either of them in almost 20 days.
Solana [ SOL ]:-
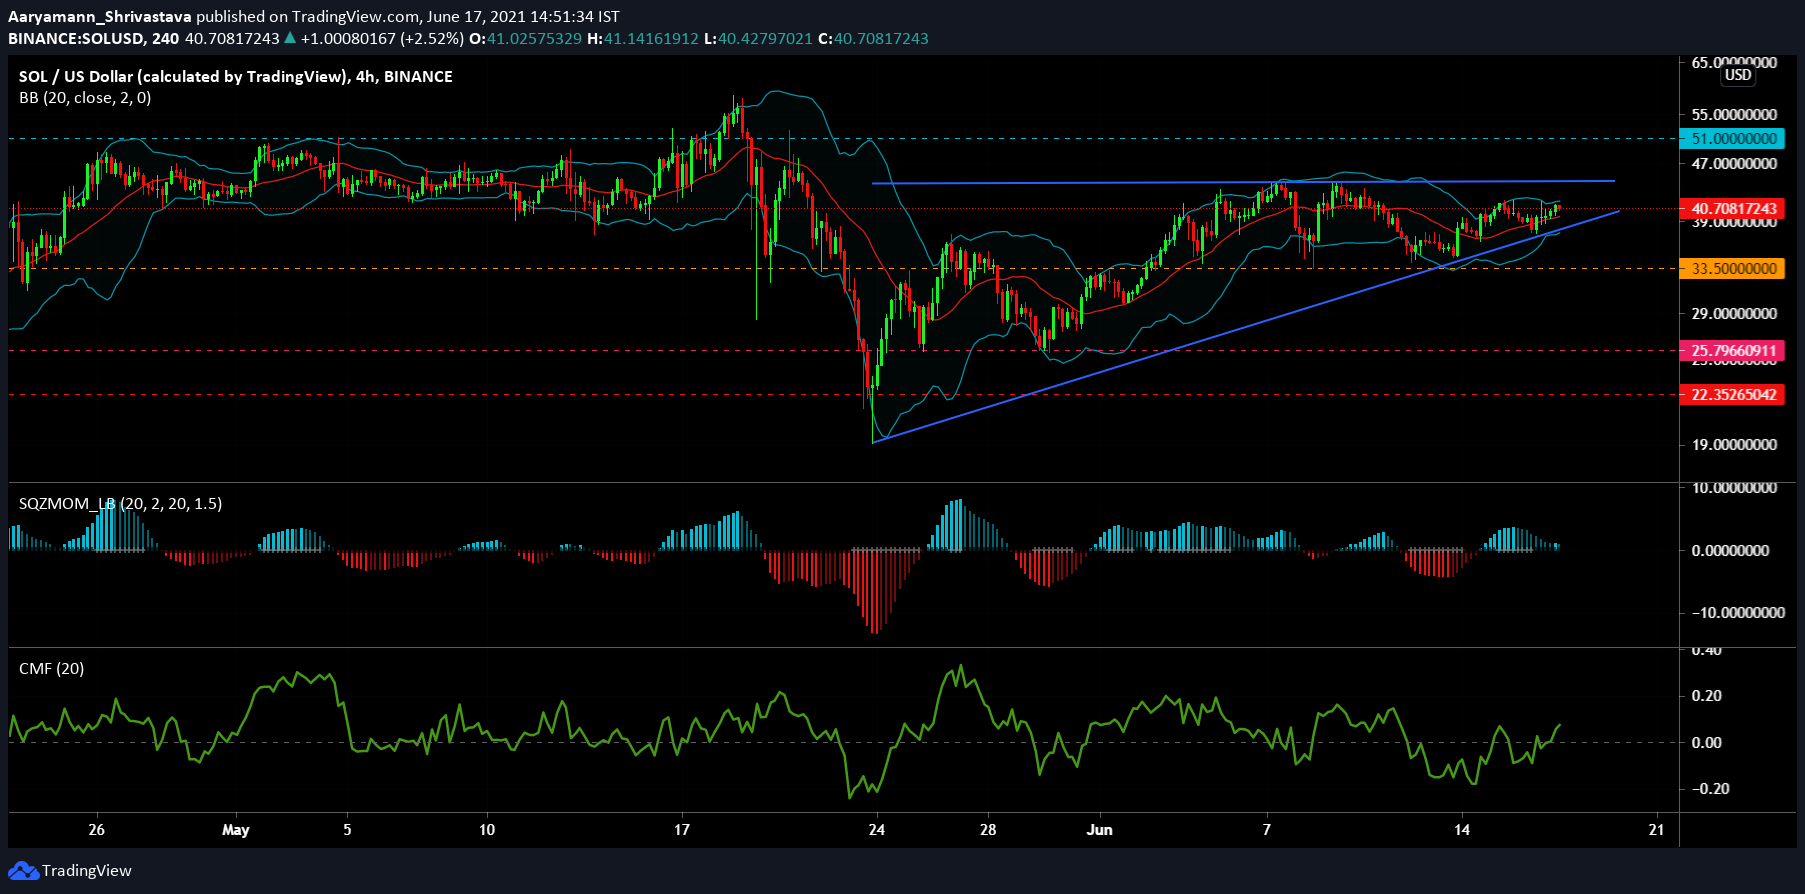
Solana continued to make a solid recovery as the coin seemed to be getting closer to its ATH. SOL formed an ascending triangle on the 4-hour chart and a breakout seems to be likely going forward. As the upper trend line of the triangle sits under the resistance at $44.6, this would push the coin further upwards. Bollinger Bands remained parallel at press time with the basis acting as support for the coin.
Squeeze Momentum Indicator exhibited mixed signals as the dark blue bar hinted towards receding bullish pressure. The black dots indicated that SOL was in an active squeeze at the time of writing. Chaikin Money Flow displayed rising capital inflows as the green line indicator inclined past the neutral line.
If SOL breaches the upper trend line, it would get closer to its $51 resistance level and safer from falling to the $33 support level.
MATIC:-
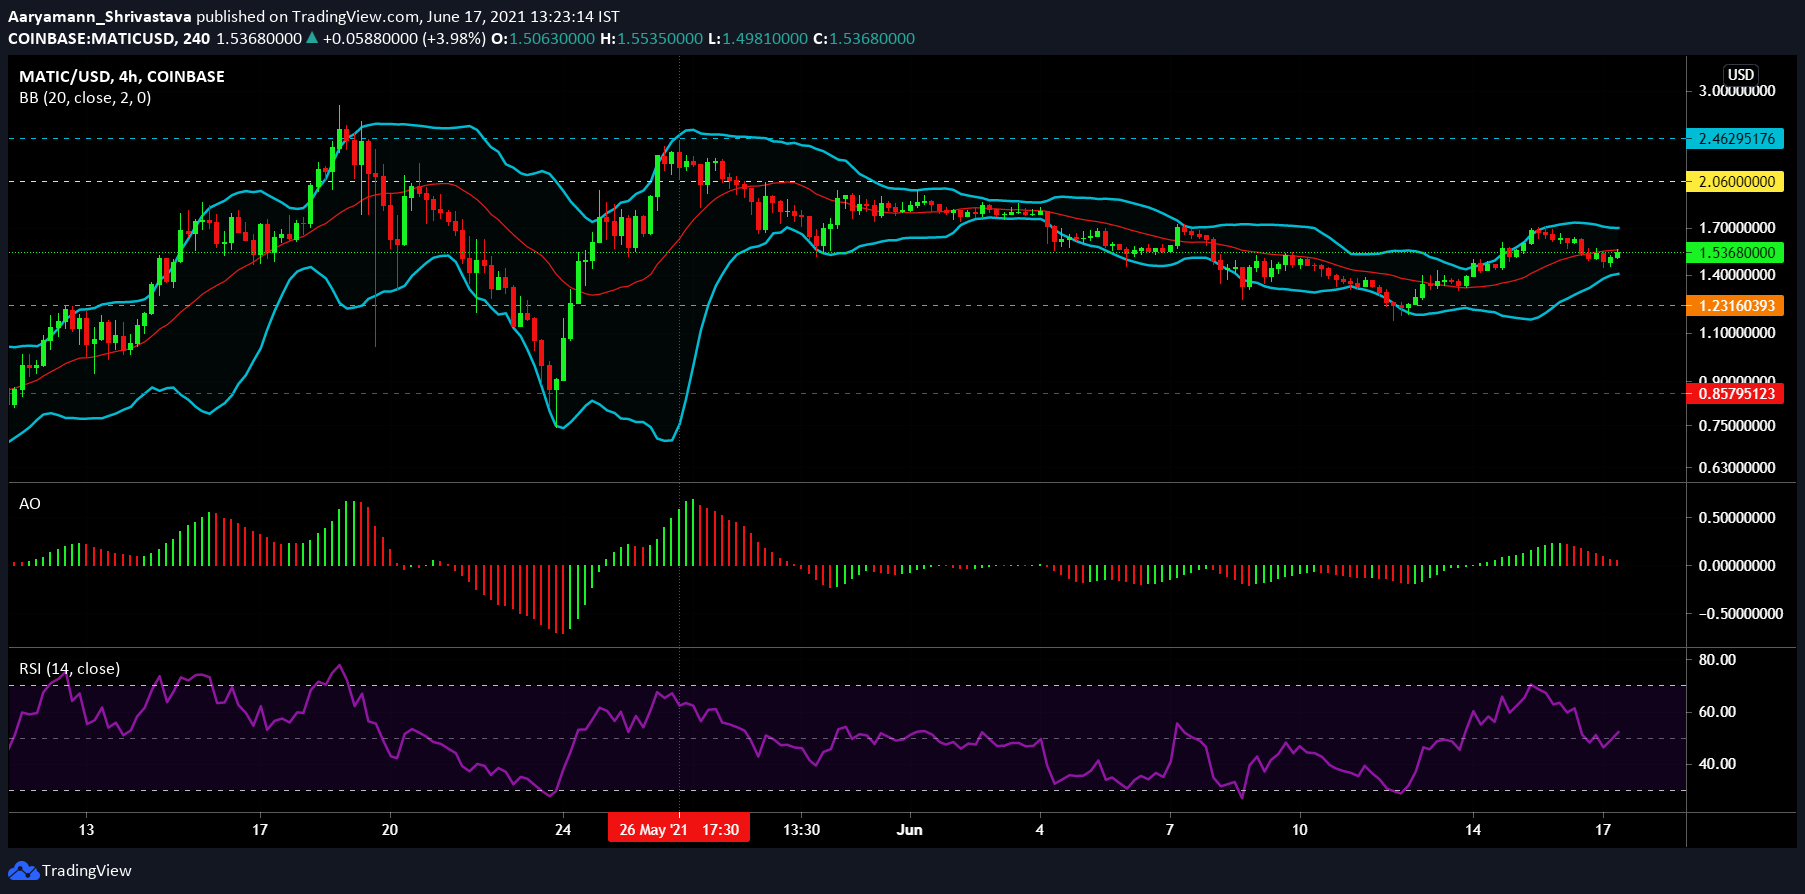
MATIC remained far from reaching its ATH after the fall of May 26 but consolidated itself within the strong support ($1.23) and resistance ($2.06) levels. Trading at $1.53, the coin moderately rose and continued its sideways movement on the 4-hour chart. Bollinger Bands remained parallel as its basis moved into resistance. This indicated price fall, without much volatility.
Awesome Oscillator was all red at press time as bearish momentum dominated the indicator. Relative Strength Index (RSI) moved within the bullish neutral territory. The purple line rose slightly after selling pressure pushed the indicator from the oversold region towards the neutral zone.


