Ethereum: The probability of a trend reversal after a 65% hike is…

Ethereum has recorded some great gains recently. In fact, it rallied farther than Bitcoin did.
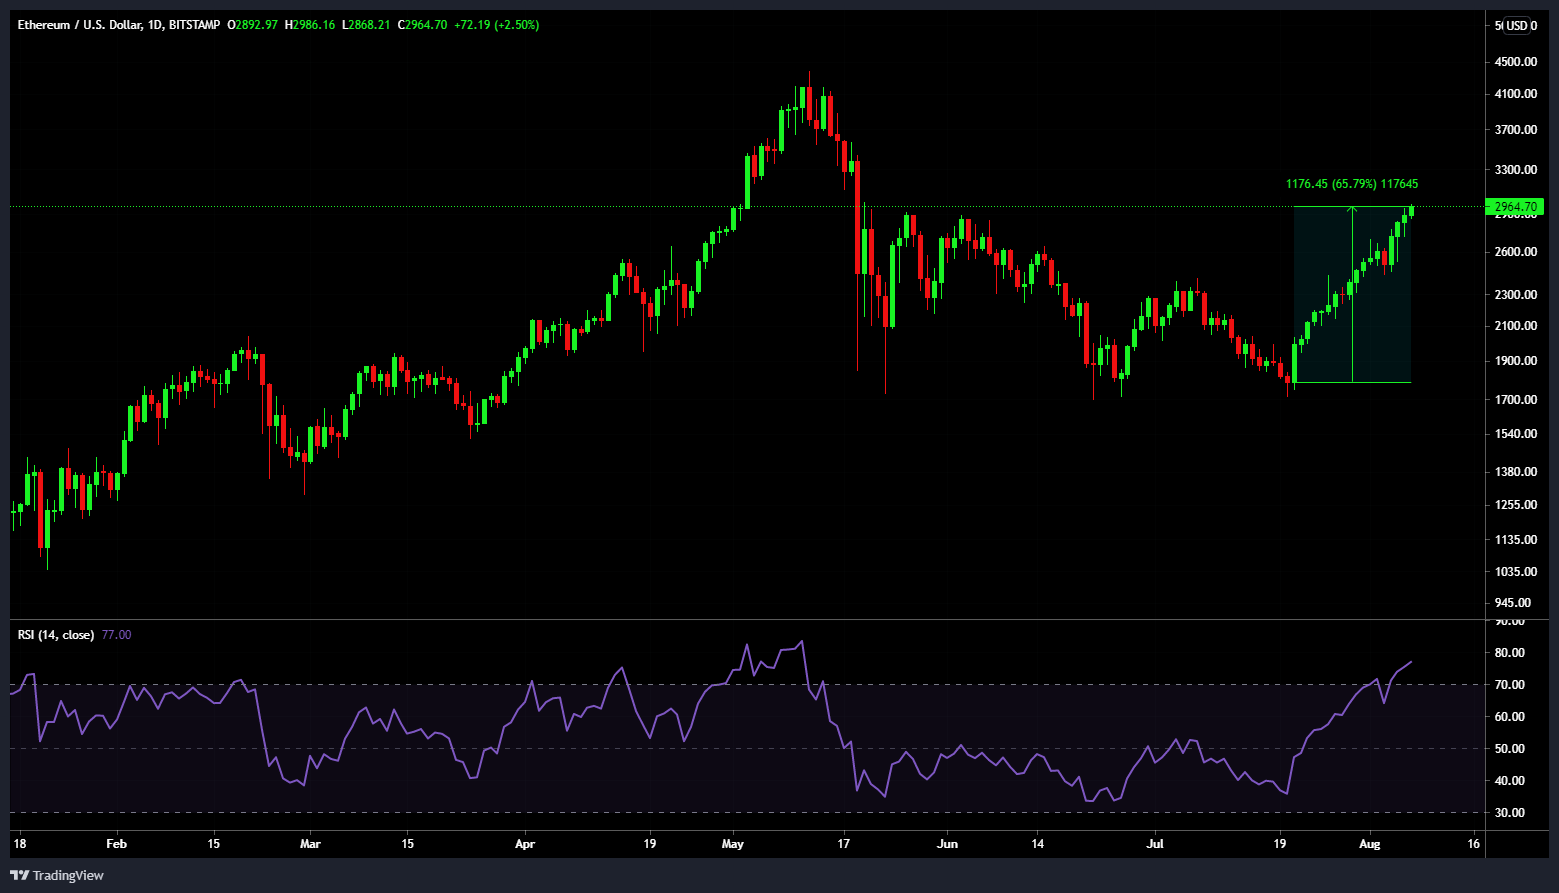
Consider the last 17 days, for instance. With the exception of 3 August, ETH closed every other day in the green. With the altcoin rallying by as much as 65%, one would expect the price to only go higher going forward.
However, that may not really be the case, with popular analyst Rekt Capital highlighting,
Daily close above ~$2930 and $ETH will likely accelerate towards ~$3260#Crypto #Ethereum pic.twitter.com/Ov1xRlSvcu
— Rekt Capital (@rektcapital) August 6, 2021
Ethereum may not be bullish for long
Despite the aforementioned 65.79% hike, ETH might not actually rally anymore. This assertion can be better understood by looking at the changes noted by the alt’s Relative Strength Index. The RSI is a reflection of whether a crypto is overbought or oversold. The indicator in question also dictates the likelihood of a trend reversal.
As far as Ethereum is concerned, at press time, the RSI had climbed well into the overbought zone.
At the time, the indicator was as high as it was back in May when the market last rallied. Soon after, however, ETH corrected significantly. While there is no suggestion that the altcoin will depreciate as badly as it did then, it definitely does not point to a $300 hike.
Even if it manages to sustain this movement, at best, it could linger there for a few more days. However, the likelihood of eventually falling back down is high. This could break the rally and Ethereum could either enter a consolidation phase or correct down the charts going forward.
This, in spite of ETH breaking the month-long resistance level which kept the crypto under $2,700 for 4 months. However, ETH is yet to confirm this breakout since there are still some weeks left for the monthly close.

What do the metrics say?
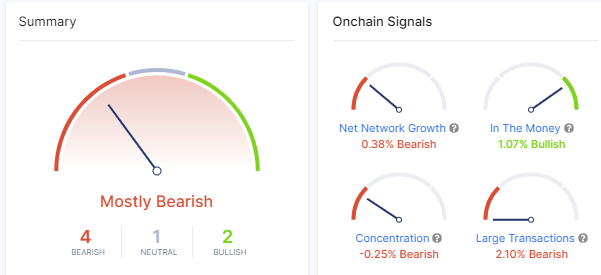
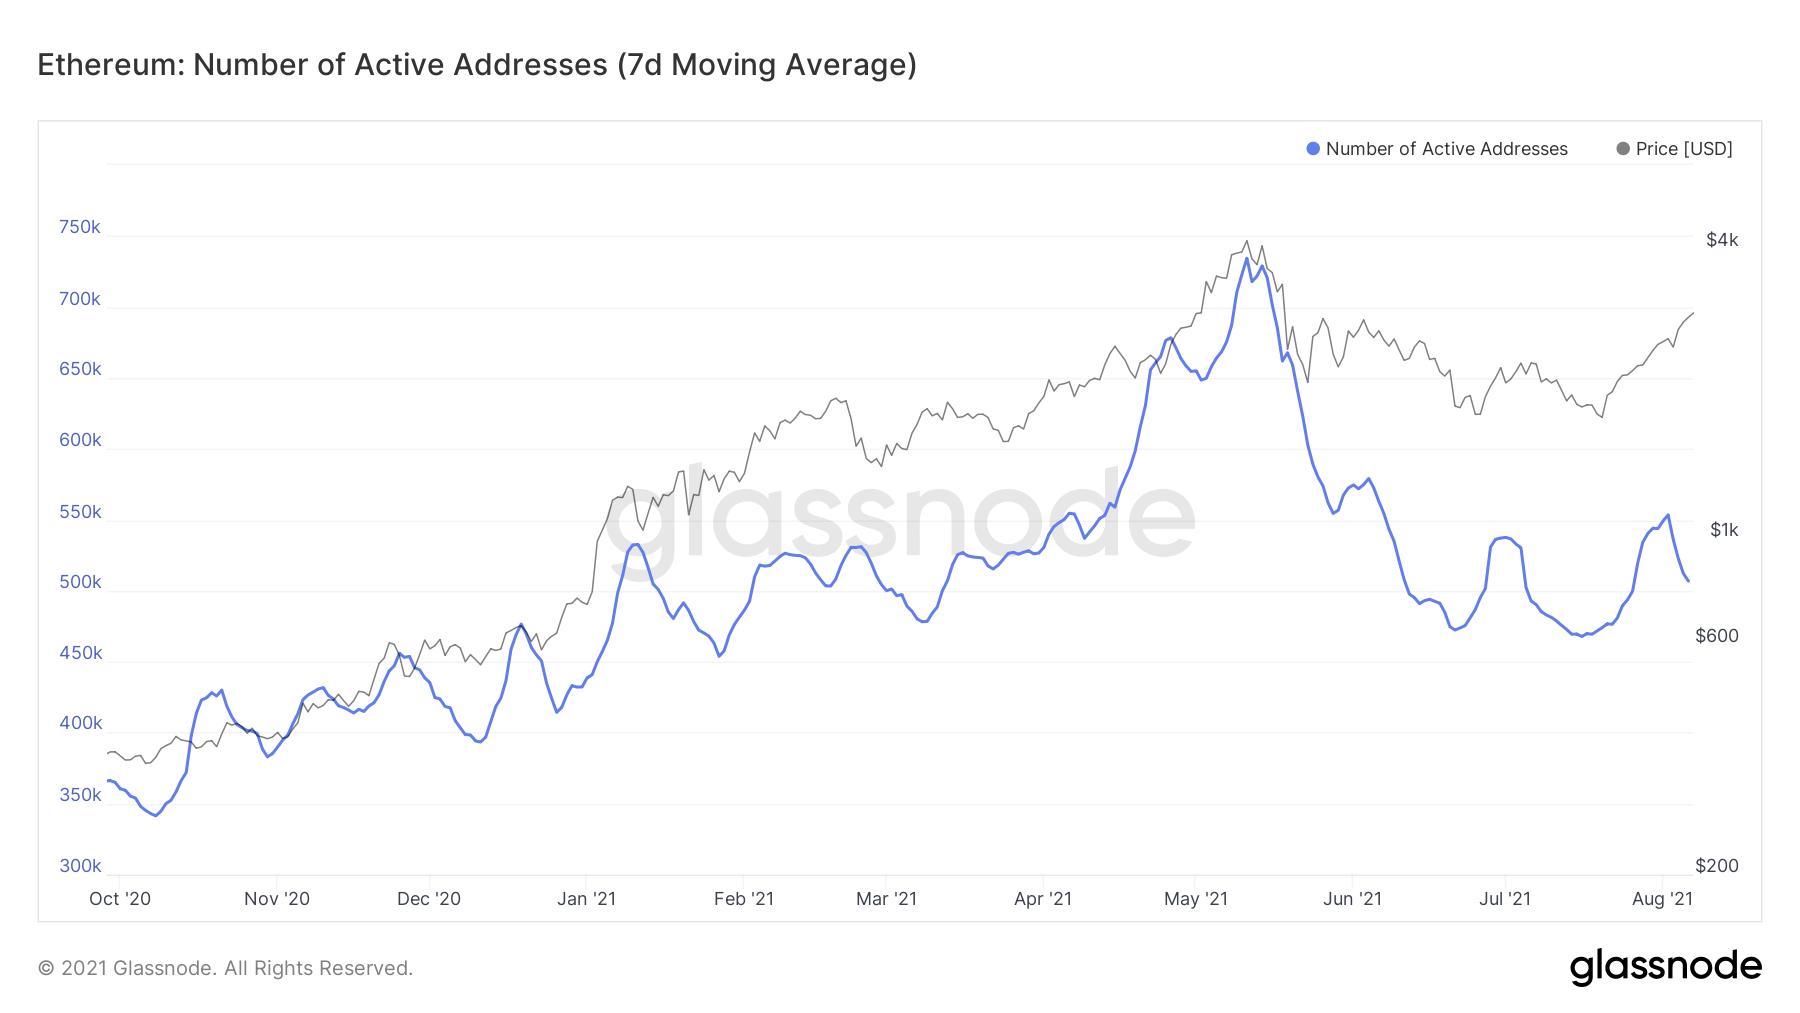
Ethereum’s on-chain metrics seemed to support the aforementioned development as well. On the whole, on-chain data presented a bearish signal for Ethereum. Not only that, participation too has come down considerably as active addresses remained low. In fact, at the time of writing, they were at a monthly low.
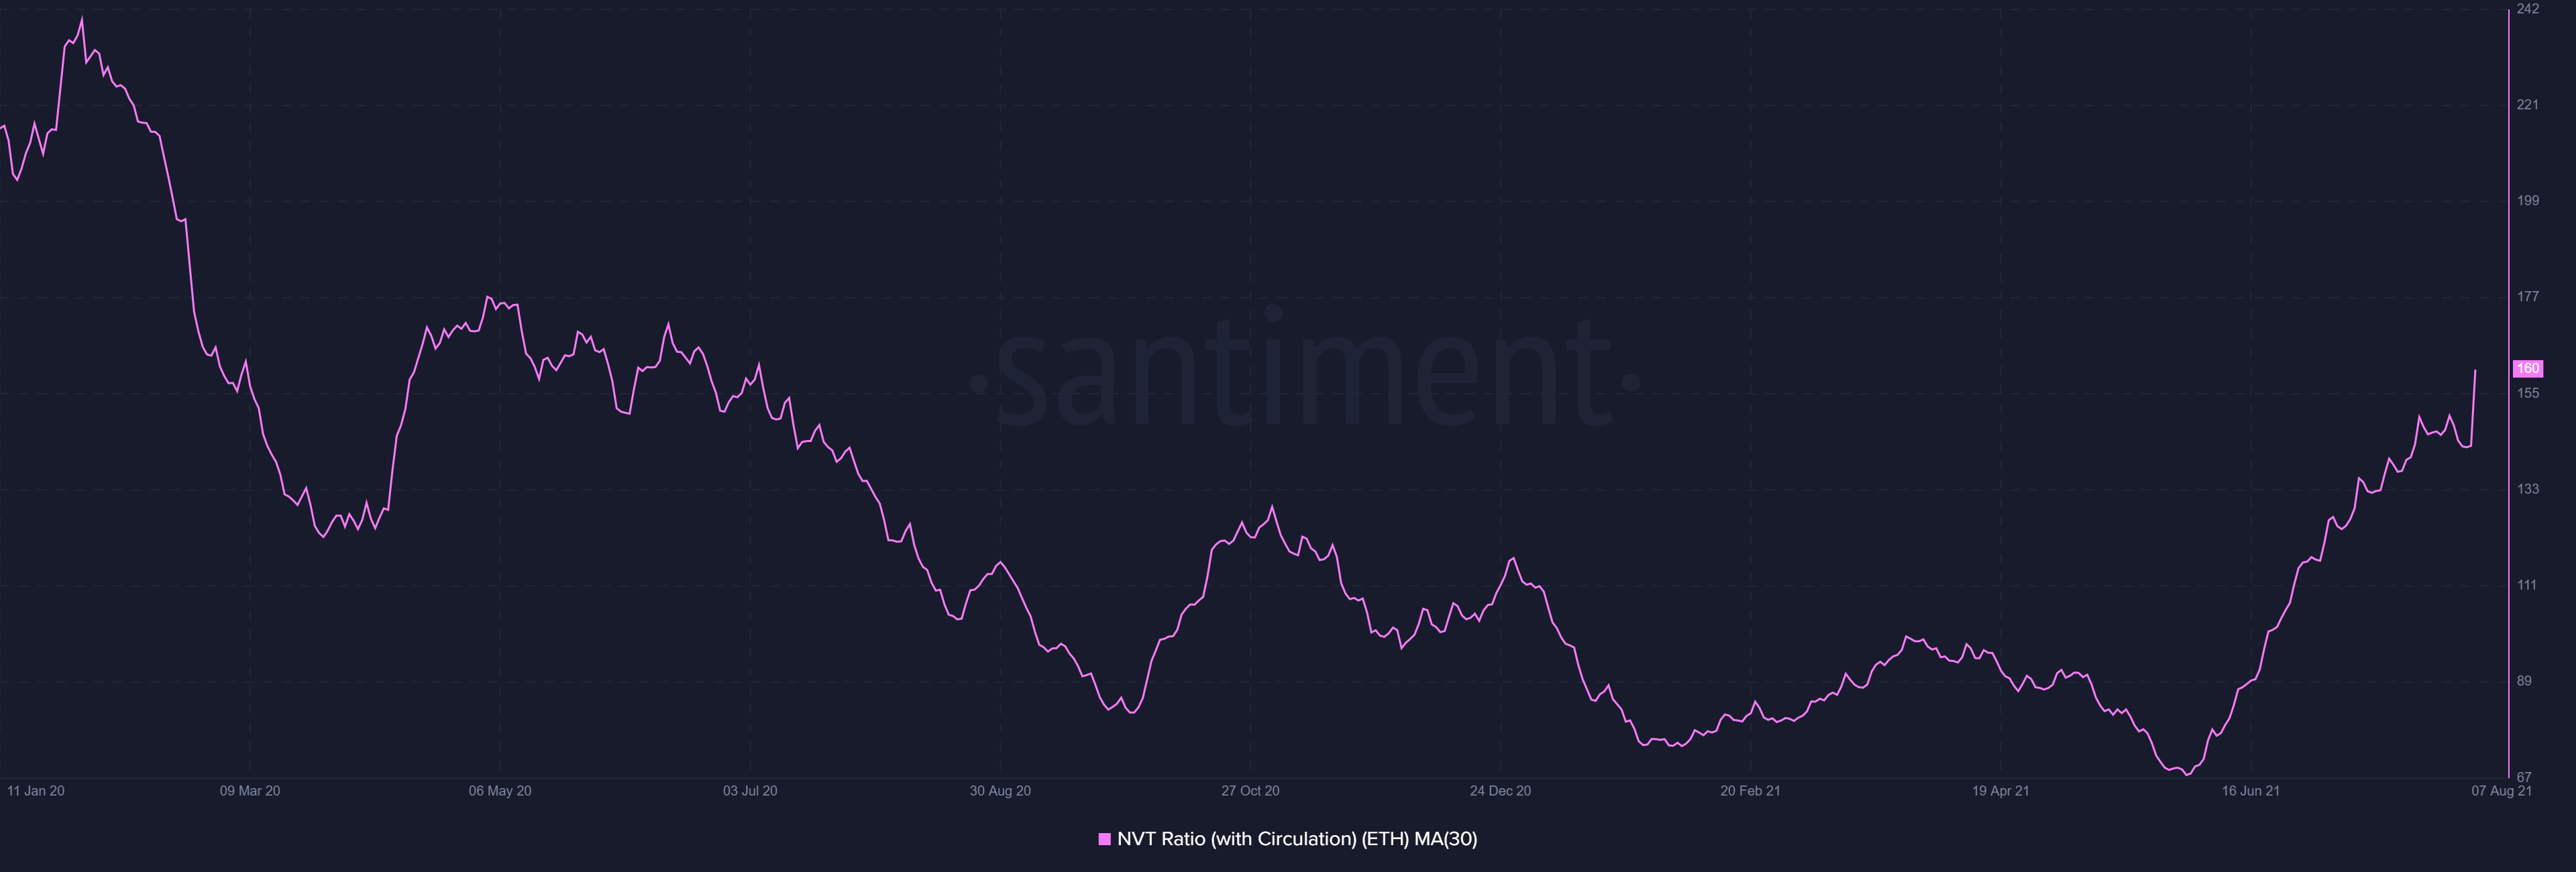
Additionally, the Network Value to Transaction (NVT) ratio on the 30-day Simple Moving Average (SMA) is currently at a yearly high. This is another sign that the altcoin may see corrections soon since the indicators implied trend reversal.
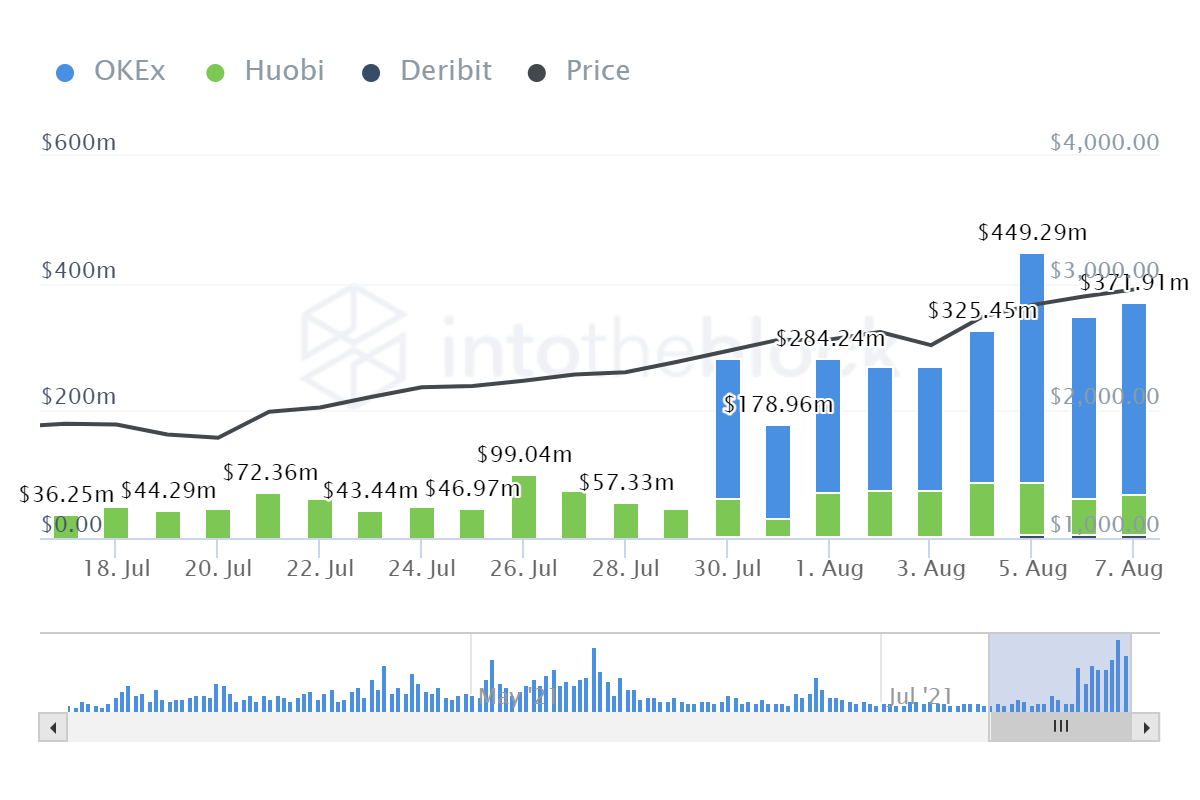
That being said, it wasn’t all bad news. There has been some good news on the derivatives front, with both Open Interest and Future Volumes appearing to be strong for Ethereum.
When the trend reversal hits, ETH could see some significant corrections. Ergo, investors may be advised to watch the markets closely before making any decisions.


