Ethereum: This price range can unlock ETH’s breakdown potential

Disclaimer: The findings of the following analysis are the sole opinions of the writer and should not be considered investment advice
Over the last three days, Ethereum [ETH] sustained its uptrend while compressing in its reversal pattern (white). With the $1,714 level bearing a rebound zone for the bearish pulls, the king alt could now hover near its 20/50/200 EMA before breaking into high volatility.
Should the current reversal pattern stand sturdy, it could reject higher prices for a while before a likely bull revival. At press time, ETH traded at $1,704.6, up by 4.1% in the last 24 hours.
ETH 4-hour Chart
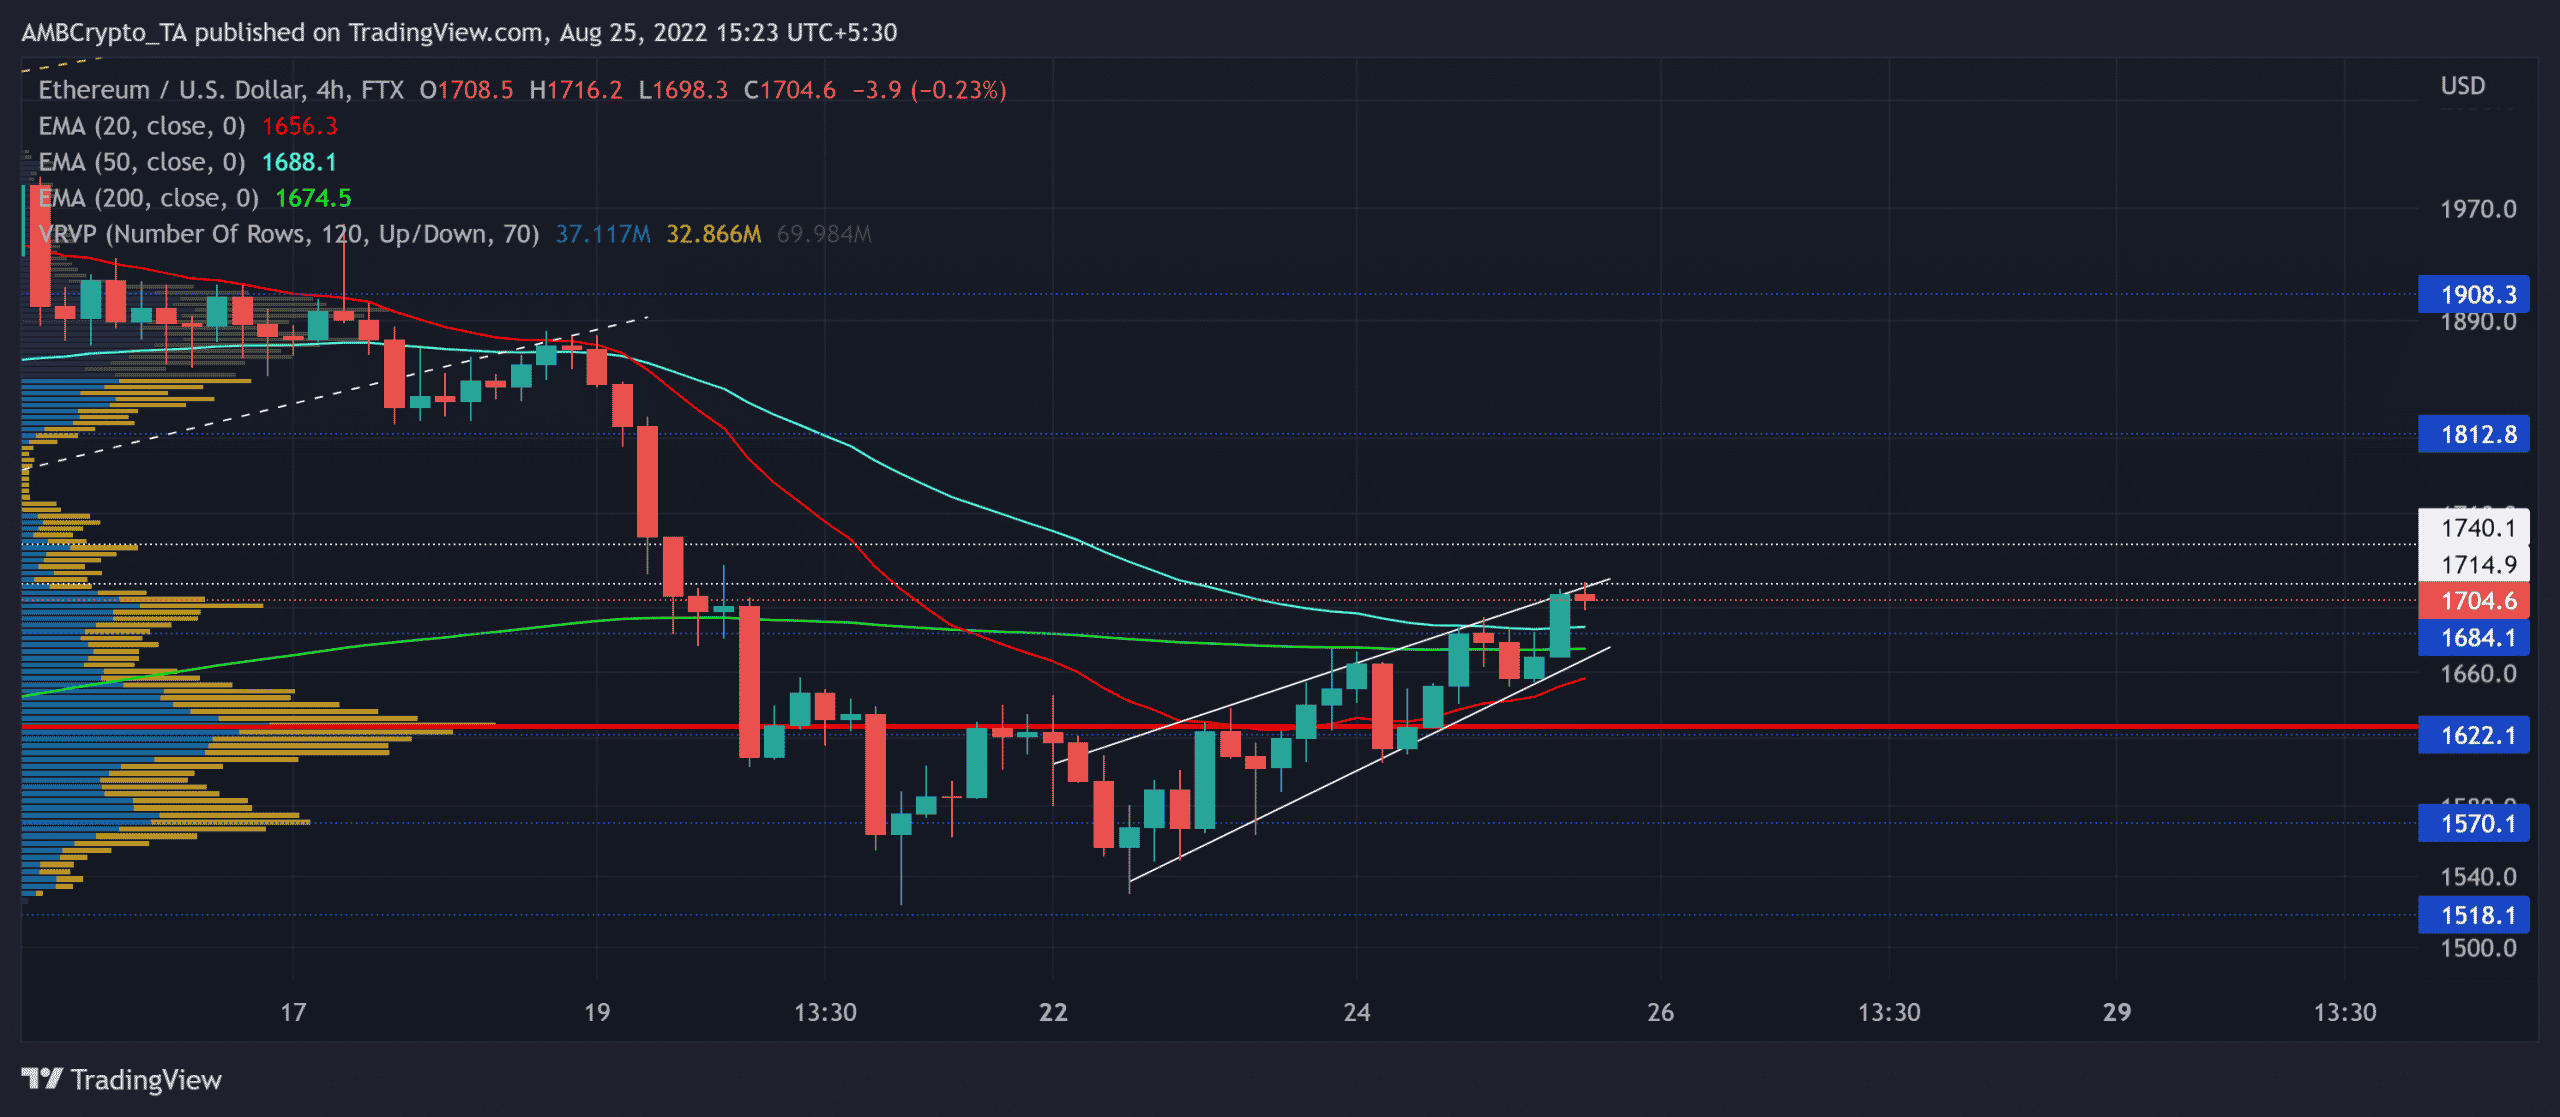
ETH reassumed its bearish track in the last ten days as it plunged below its near-term and the 200 EMA. But its growth in the past three days has aided the bulls in closing above the EMA barriers. This selling comeback reignited after ETH reversed from its two-month high on 11 August.
With the bears posing hurdles near the upper trendline of the bearish pennant-like structure, ETH is marking a slight rejection of higher prices in the $1,714 region.
Meanwhile, the coin witnessed a declining trend in trading volumes during the recent growth. This reading has further affirmed the weakness of the bullish move.
A close below the EMAs could propel a patterned breakdown. In this case, the potential targets would lie in the Point of Control (POC, red) region [$1,626 zone]. An eventual break above the $1,700 resistance could pave a path for a relatively short-lived bull run in the $1,740-$1,800 range.
Rationale

The Relative Strength Index (RSI) moved along the threshold of the 59-mark resistance at press time. A compelling reversal from this level can hint at near-term ease in buying power.
Furthermore, the Chaikin Money Flow (CMF) peaked towards its overbought region. A likely reversal would resonate with the retracement possibilities on the chart.
Also, the Volume Oscillator went south during the recent gains and reaffirmed the weakness of the current bull run.
Conclusion
Given the confluence of the bearish pattern alongside the weak readings on the indicators, ETH could see a slight setback before picking itself again.
A sustained close above the 20/50/200 EMA would invalidate the bearish inclinations. The targets would remain the same as discussed above.
Finally, investors/traders must watch out for Bitcoin’s [BTC] movement. This is because ETH shares a 78% 30-day correlation with the king coin.


