Ethereum to $5500 – Here are the metrics that say it can

For a change, Ethereum has had a better week than Bitcoin. The world’s largest alt has been recovering over the past few days, but went on to touch the $2600 mark only on Sunday. In fact, at press time, ETH was trading at $2616.43 after weekly gains of 12.2%.
With the London hard fork approaching, the balance of Ethereum on exchanges has been shrinking too. In fact, it has been hitting consecutive lows of late. Towards the beginning of June, the cumulative balance on exchange wallets was well above the 21 million mark. However, within the span of two months, the same has fallen by over 1.5 million.
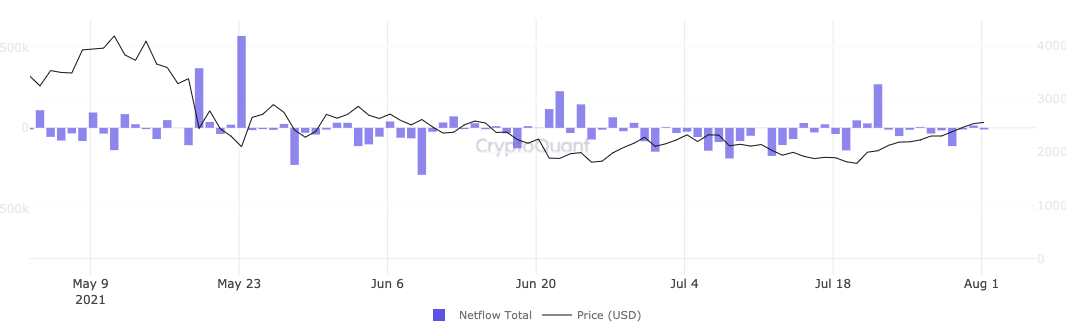
Additionally, the exchange net flow indicator also highlighted that the outflows have, by and large, been overshadowing the inflows since June. Cumulatively, these two indicators asserted the fact that market participants expect the price of ETH to react positively to the upgrade. Hence, they are buying additional tokens. It also underlined the minimal selling pressure present in the ETH market today.
What’s more, the amount of staked ETH has drastically risen over the past few weeks and so has the ETH locked in DeFi. What this implies is that ETH tokens being withdrawn from exchanges are not necessarily lying idle and market participants are playing it safe before the hard fork.
Is it too early to expect an ATH?
Interestingly, ETH’s MVRV (market-value-to-realized-value) ratio has not dunked below 1 since June 2020. This essentially indicates that investors have been fetching additional returns than usual over the past few months. Whenever this indicator inches towards 3.7, it intensifies the odds of a market top.
The MVRV had breached the same during ETH’s rally earlier this year and also during 2017’s mega bull run.
At press time, the ratio seemed to be heading towards the same level. In less than two weeks’ time (from 20 July to 1 August), the reading on this indicator had inched up from 1.50 to 2.18. If the trend continues at the same pace, Ethereum’s price might soar and make new all-time highs within a period of six weeks from now. Thus, an intensified rally can be expected to begin anytime in the coming weeks.
It should additionally be noted that this ratio has not climbed above 2 very often. Whenever it has managed to do so, however, the MVRV has breached the 3.7 level more often than not. The same has also had a ripple effect on ETH’s price.

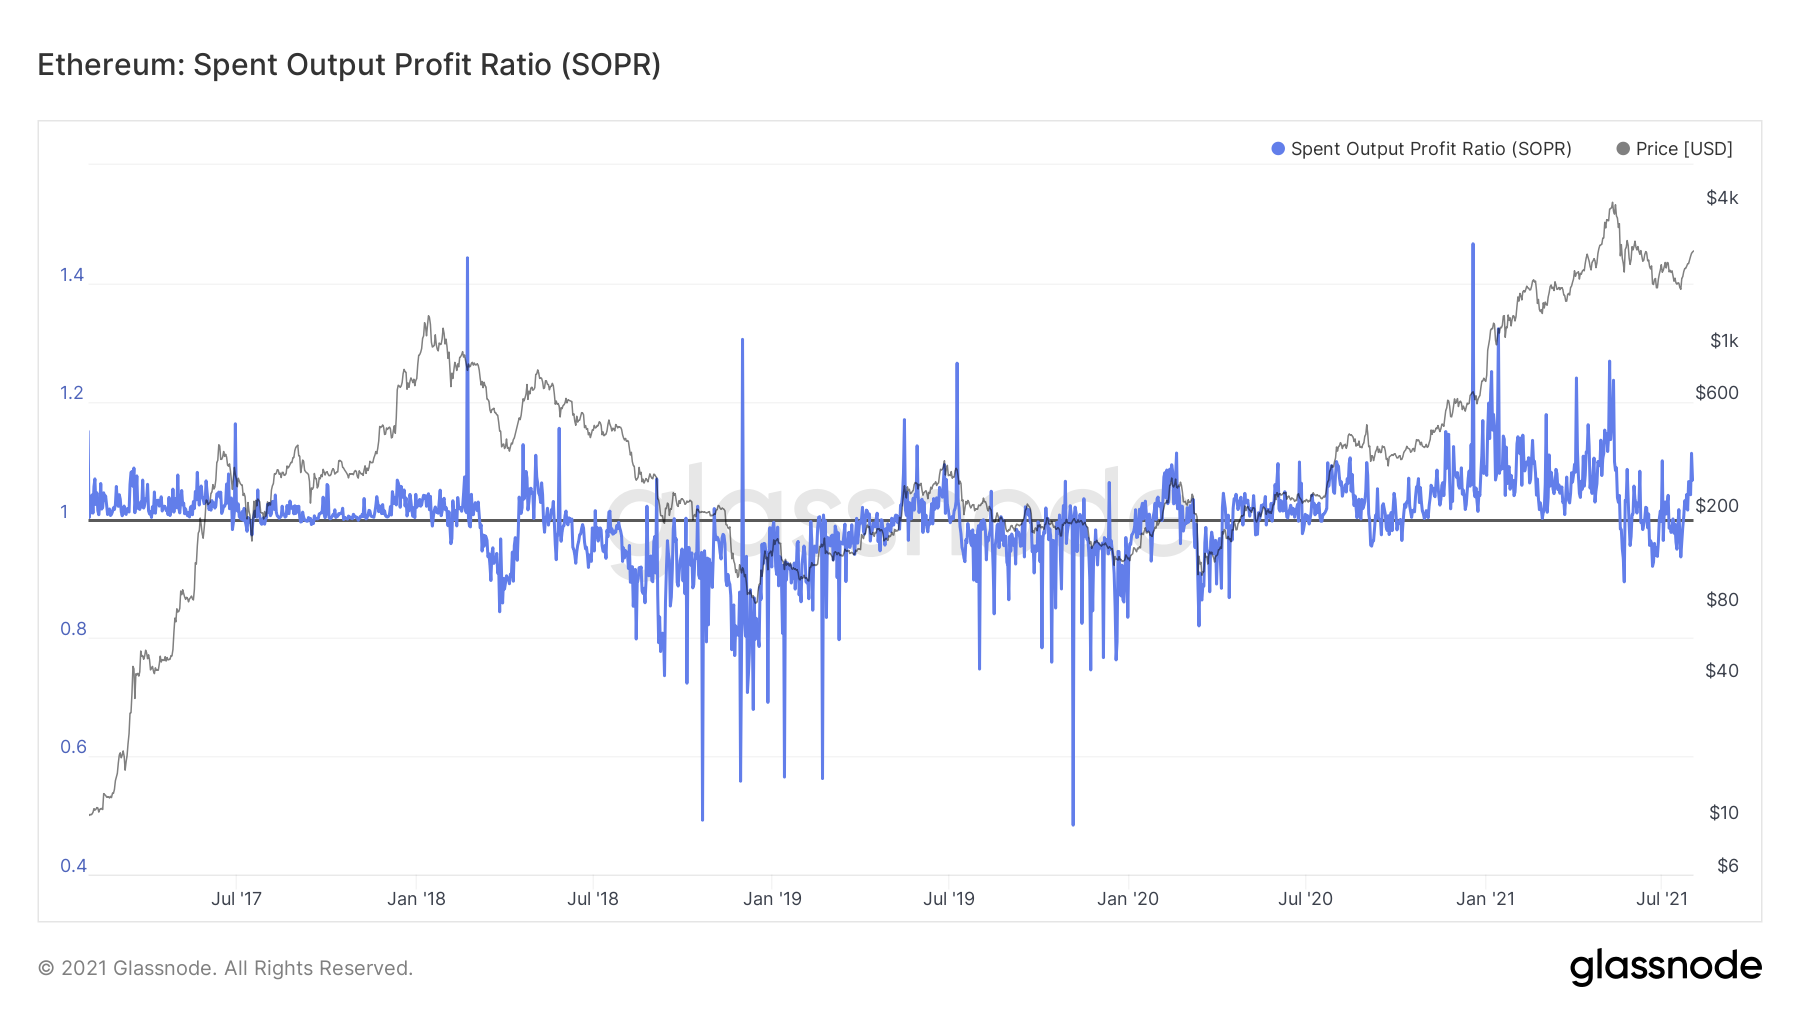
Furthermore, the SOPR (spent output profit ratio) highlighted another intriguing trend. This ratio has been fluctuating around 1 since early June. A congruent trend has also been observed twice in the recent past.
During the first instance in 2019 (mid-May to end of July), ETH’s price witnessed a spike of 67% while during the second instance in 2020 (mid-March to mid-July), the alt’s price rallied by close to 112%. A hike of similar magnitudes could see ETH breach the $3500-$5500 level in August-September.
Looking at the state of the aforementioned metrics, it’d be fair to conclude that ETH’s bull run is on. When the aforementioned phase sets in, the alt’s price will most likely end up touching new ATHs.