Ethereum traders may find this price level attractive to ‘buy in’

Disclaimer: The findings of the following analysis are the sole opinions of the writer and should not be taken as investment advice
July has brought nothing more than downtrends in the Ethreum market. While the alt’s price has been on a downtrend since the beginning of the month, the dropping price itself has had very little to do with Ethereum. The pressure from Bitcoin’s market has been immense, with ETH’s market merely mirroring this fall like other altcoins out there.
At the time of writing, ETH was trading close to the $1,900-mark, having gained by 8% in the last 24 hours.
Ethereum daily chart

Source: ETHUSD on TradingView
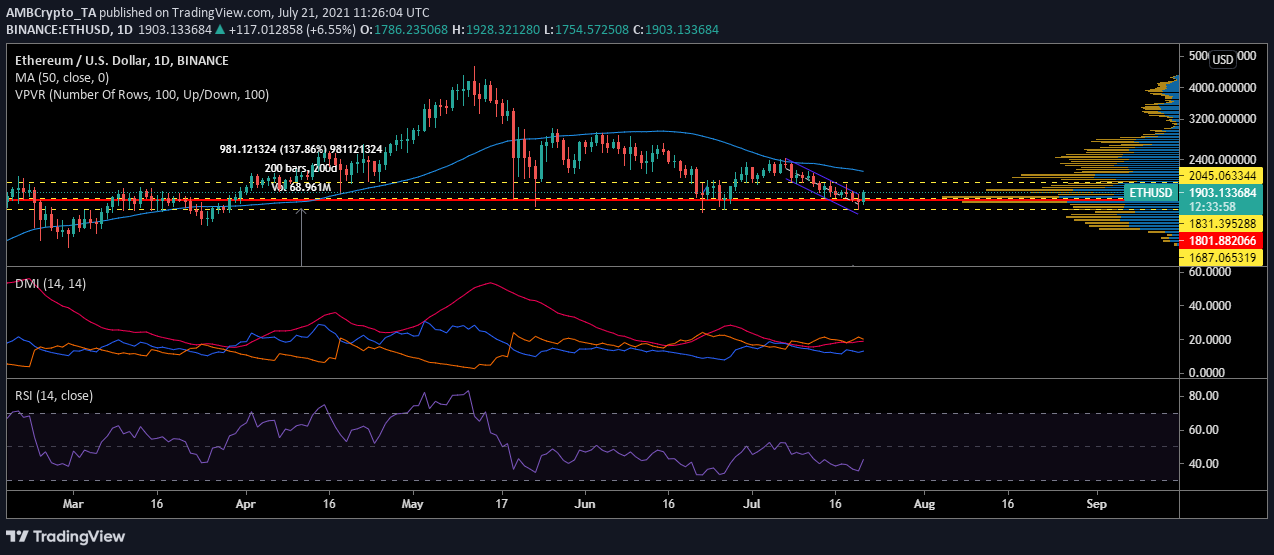
Ethereum‘s price has been moving lower within a descending channel of late. The crypto’s falling price was brought to a halt on 21 July, however, with the crypto registering a northbound surge on the charts and breaking the pattern. That being said, it did not change the prevailing bearish trend across the market.
Going forward, Ethereum may continue to trade between $1,831 and $2,045.
Reasoning
The 50 moving average took its place above the candlesticks, affirming high downwards pressure in the market. As the price continued to fall within the descending channel, the 50 MA moved higher above the price bars, suggesting a rise in the bearishness.
When the price surged from $1,687, the Visible Range underlined the Point of Control [Red line] at $1,801. This was a sign that traders were trading actively at the press time value of ETH and as the price dunked under the POC, traders engaged with this drop and bought the dip. The same was also visible when the Relative Strength Index was looked at, with the indicator skirting close to the oversold zone before the price surge pushed it close to equilibrium following a hike in buying pressure.
Despite buying pressure emerging at the said price level, traders may continue to trade ETH within the aforementioned range. The Directional Movement Index [DMI] confirmed this as downward pressure remained dominant. The -DI remained above the +DI and was also diverging – A sign of a bearish ETH market.
Conclusion
The Ethereum market could see a period of consolidation between $1,802 and $2,045 as market traders engage with its press time price. However, since the buying pressure remained low, the altcoin’s price may, by and large, continue to remain under $2,045 unless the former spikes dramatically.


