Ethereum, UNI, Stacks Price Analysis: 16 April

Ethereum pictured a bearish divergence that could see the price revisit $2,370. However, across the altcoin market, gains were massive over the past few days, as evidenced by the falling BTC Dominance. Uniswap retraced after a strong move upwards, before recovering somewhat and it could push higher still. Finally, Stacks was in a similar spot as it recovered from a deep retracement and was back near its local highs once more.
Ethereum [ETH]
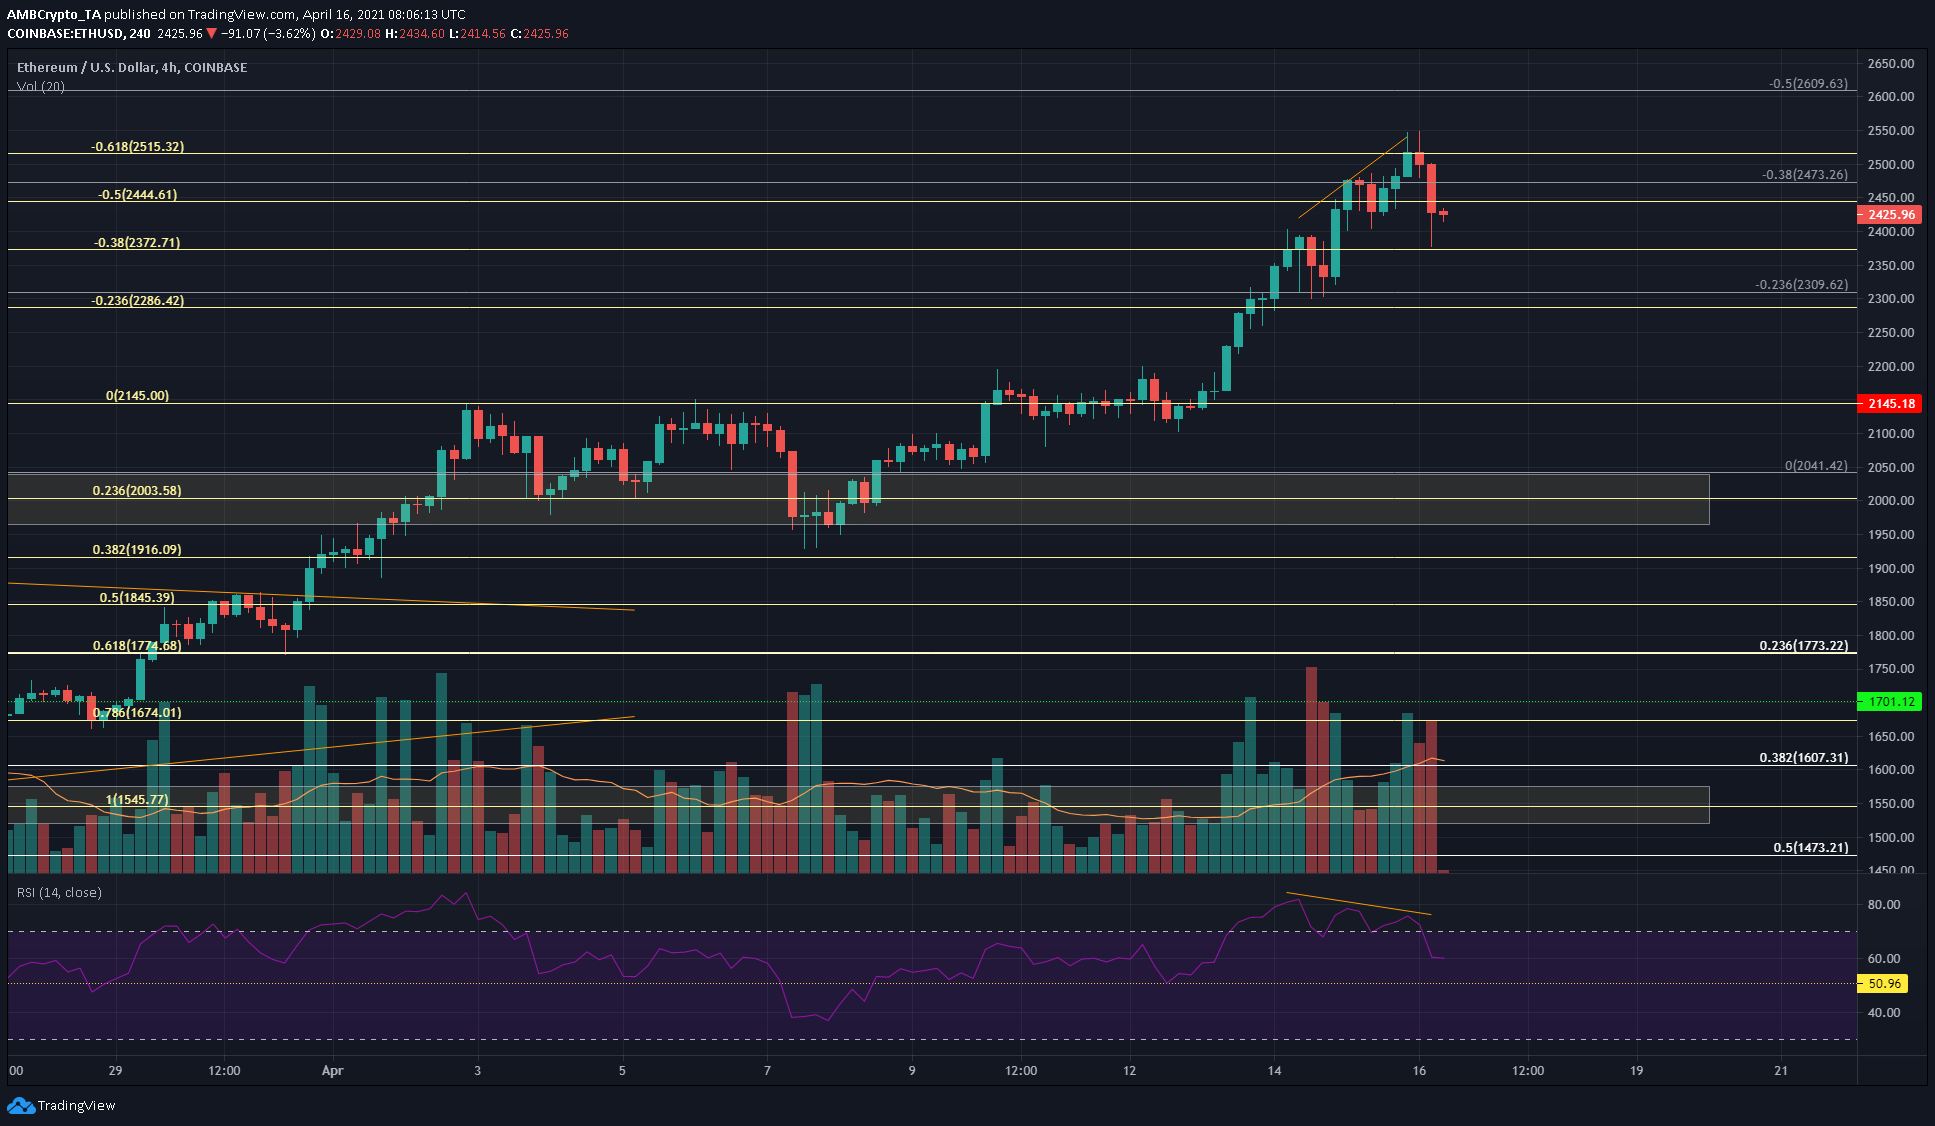
The bearish divergence between the price and the momentum (RSI) looked likely to cause a pullback. The two sets of Fibonacci Retracement levels laid out some support levels for ETH. At the time of writing, the $2380-$2400 area could see some demand arrive for ETH. A drop beneath this area will likely see ETH drop to $2300-$2310 to find buyers.
However, its long-term trend remains strongly bullish. The $2515-level was tested, and this lent credibility to the Fib extension levels plotted earlier (yellow). Targets for ETH following the pullback lay at $2743 and $3170.
Uniswap [UNI]
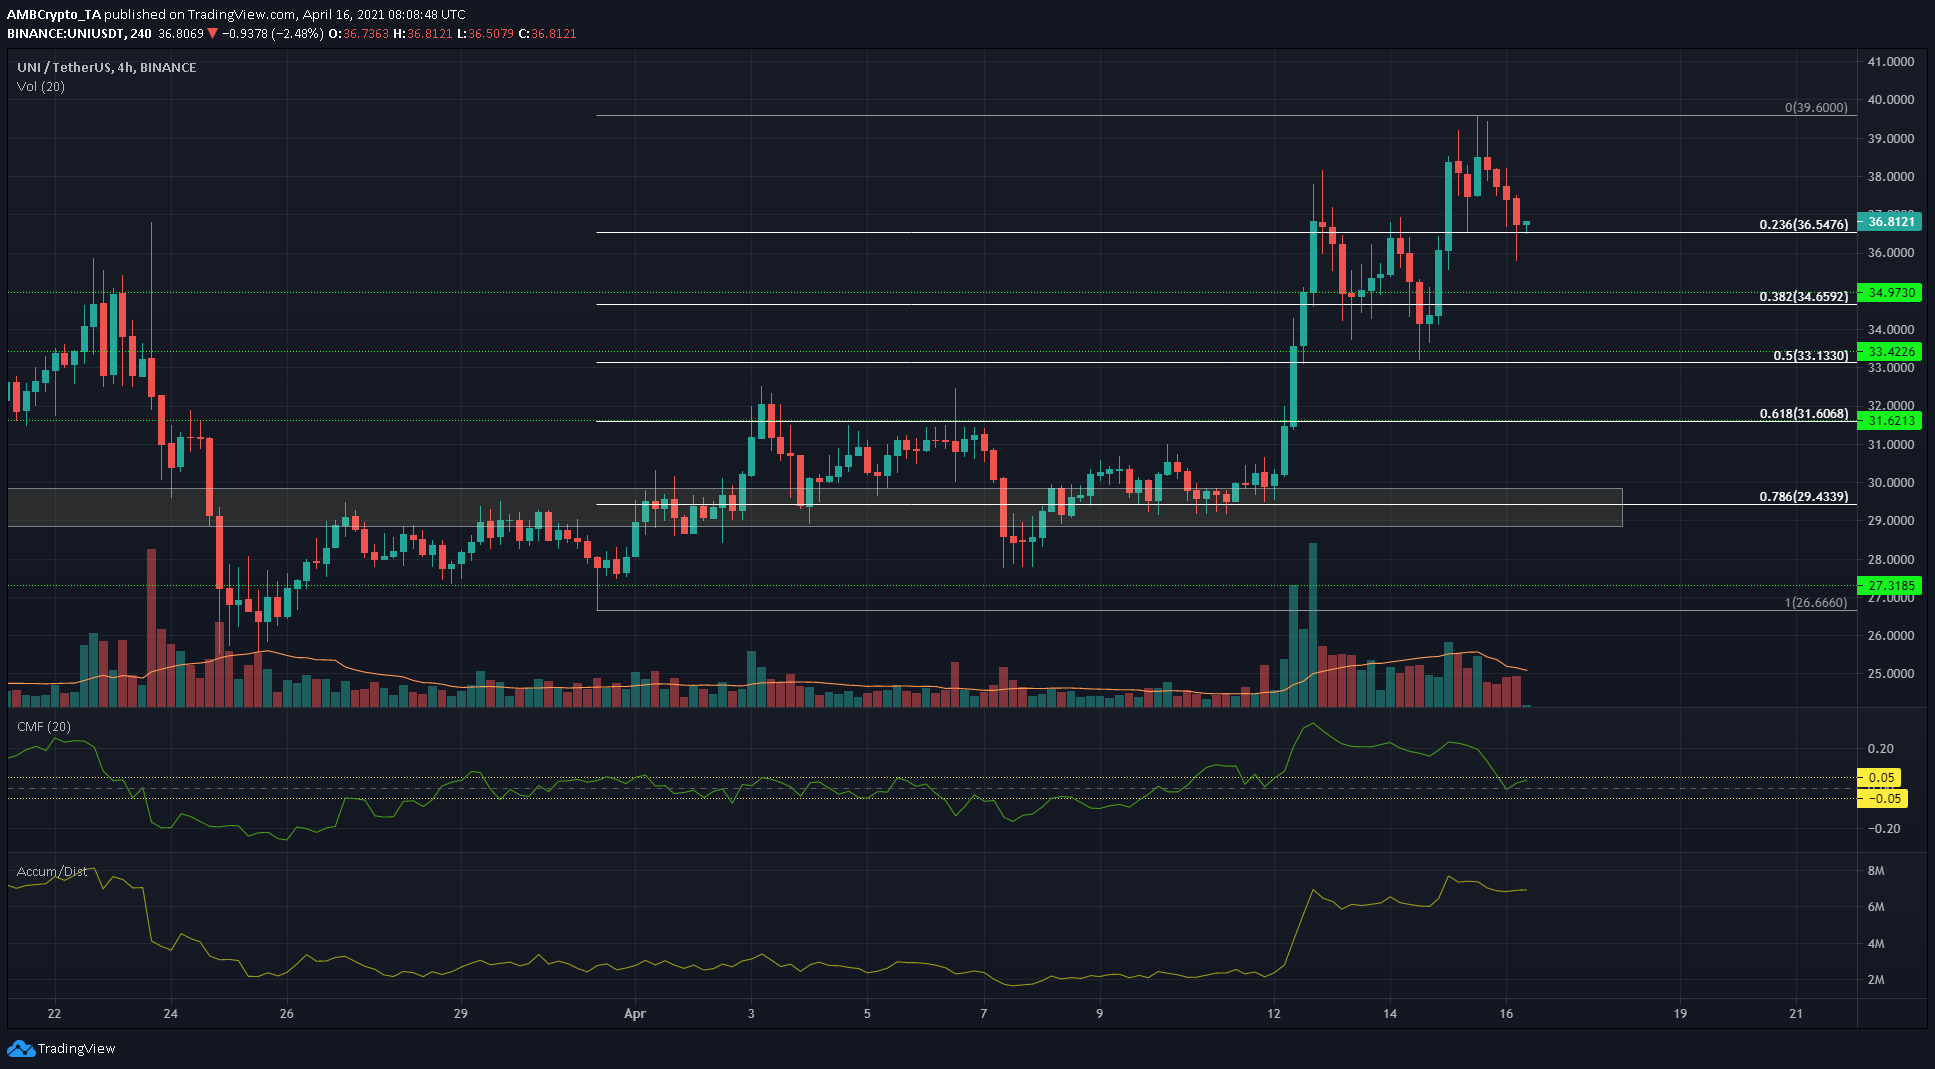
The push from the demand region at $29 to $38 last week saw UNI retrace as deep as $33.1, before surging to touch $39.6 once more. Once more, retracement levels plotted for UNI’s move these past two weeks identified some areas of demand for UNI.
The A/D line was forming higher lows to show that buying volume was dominant. The Chaikin Money Flow had dipped into the neutral territory but could head higher, something that would underline net capital flows into the market.
Stacks [STX]
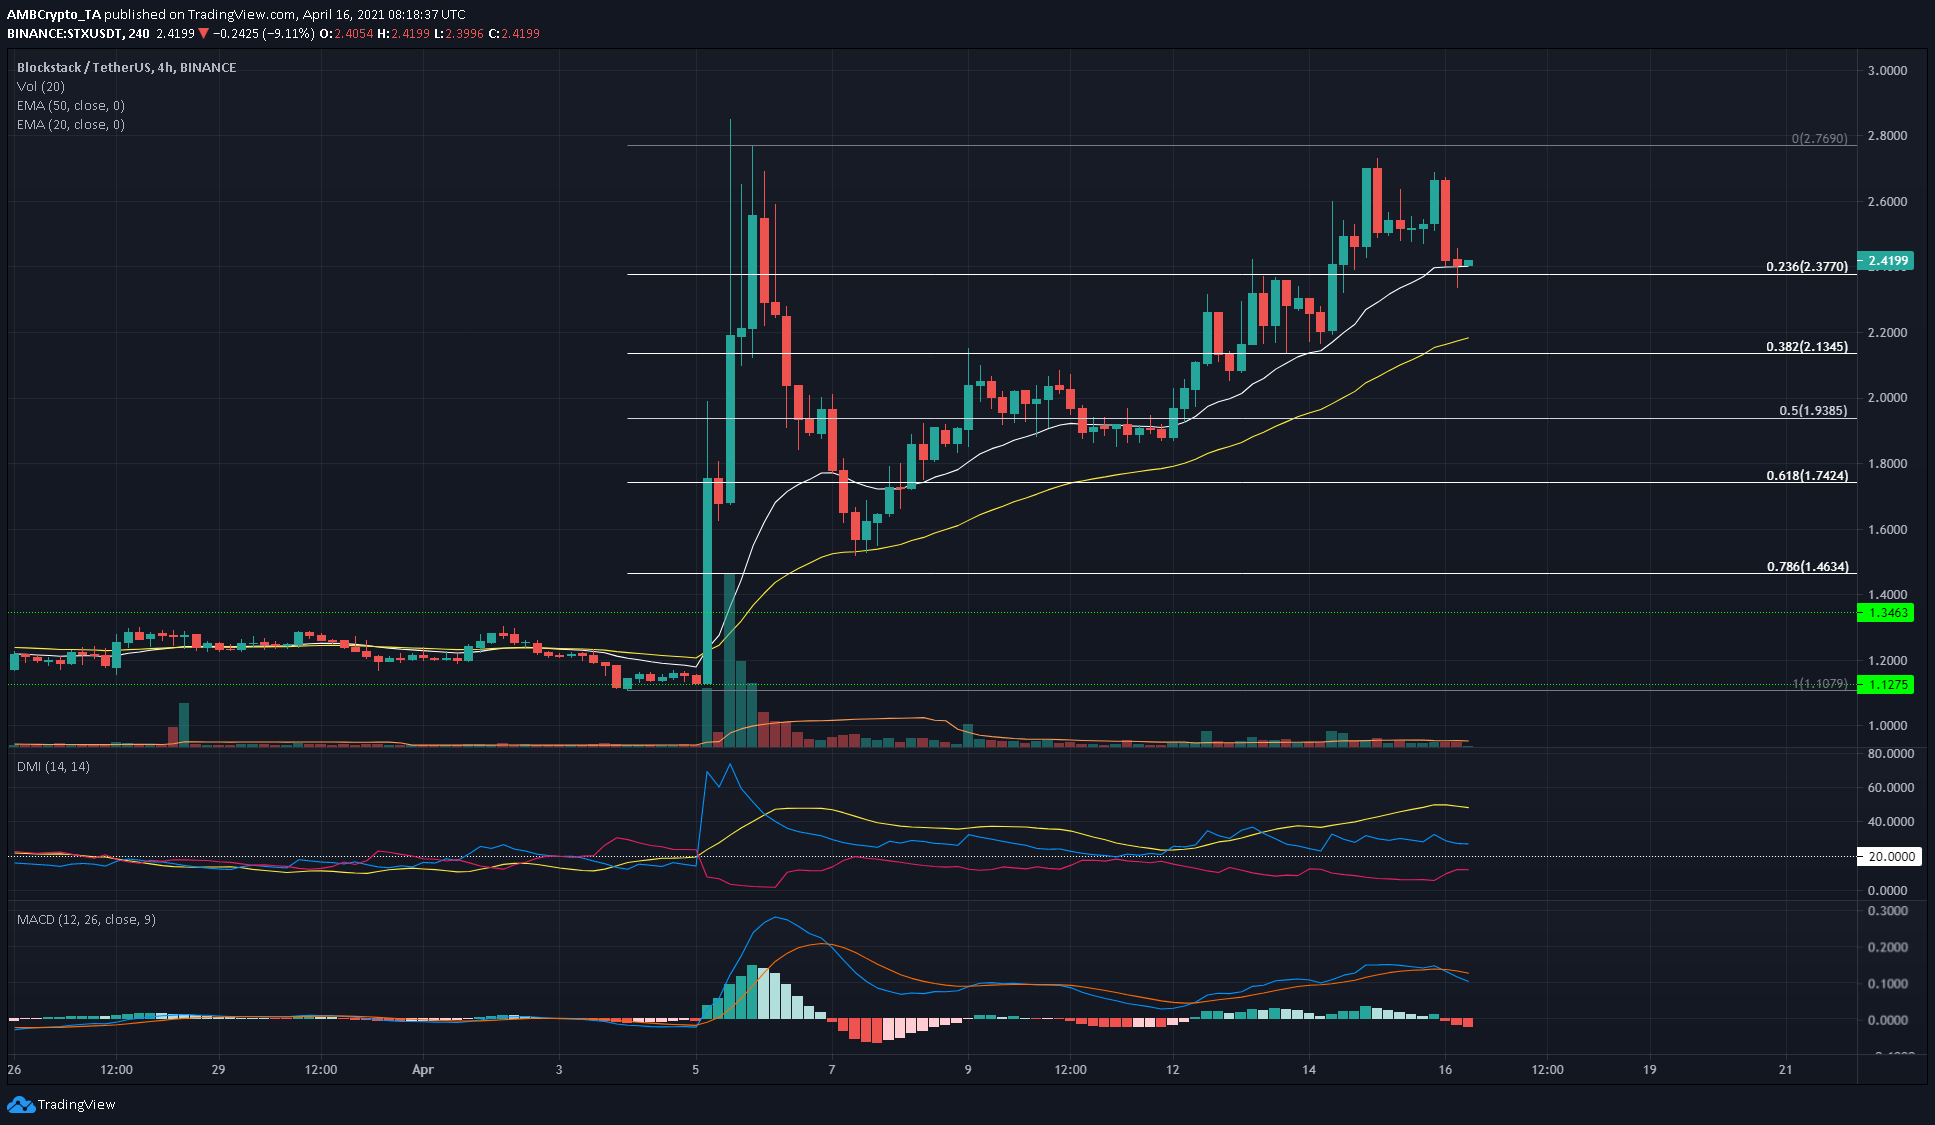
Stacks rocketed from $1.12 to $2.76 and pulled back just as sharply to find support at the 50-period EMA (yellow). Despite its deep retracement, however, the DMI continued to picture a strong uptrend behind STX over the past ten days as the ADX and the +DI (yellow and blue respectively) continued to move above 20.
The MACD formed a bearish crossover to highlight recent selling pressure but the 20 EMA (white) and the 23.6% retracement level served as support to halt the bears at $2.38. A breakout past the previous high would indicate a continuation to $3.16.