Ethereum: Unraveling ETH’s realistic near-term revival chances

Disclaimer: The findings of the following analysis are the sole opinions of the writer and should not be considered investment advice.
Ethereum [ETH] marked a double-digit growth over the last week as it rebounded from its $1,440 support level. With the $1,600-$1,700 range reflecting a supply zone for the bearish pulls, the king alt could face near-term hurdles in the coming sessions.
Should the current resistance stand sturdy, it could reject higher prices and make way for a sluggish phase. At press time, ETH traded at $1,573.8.
ETH Daily Chart
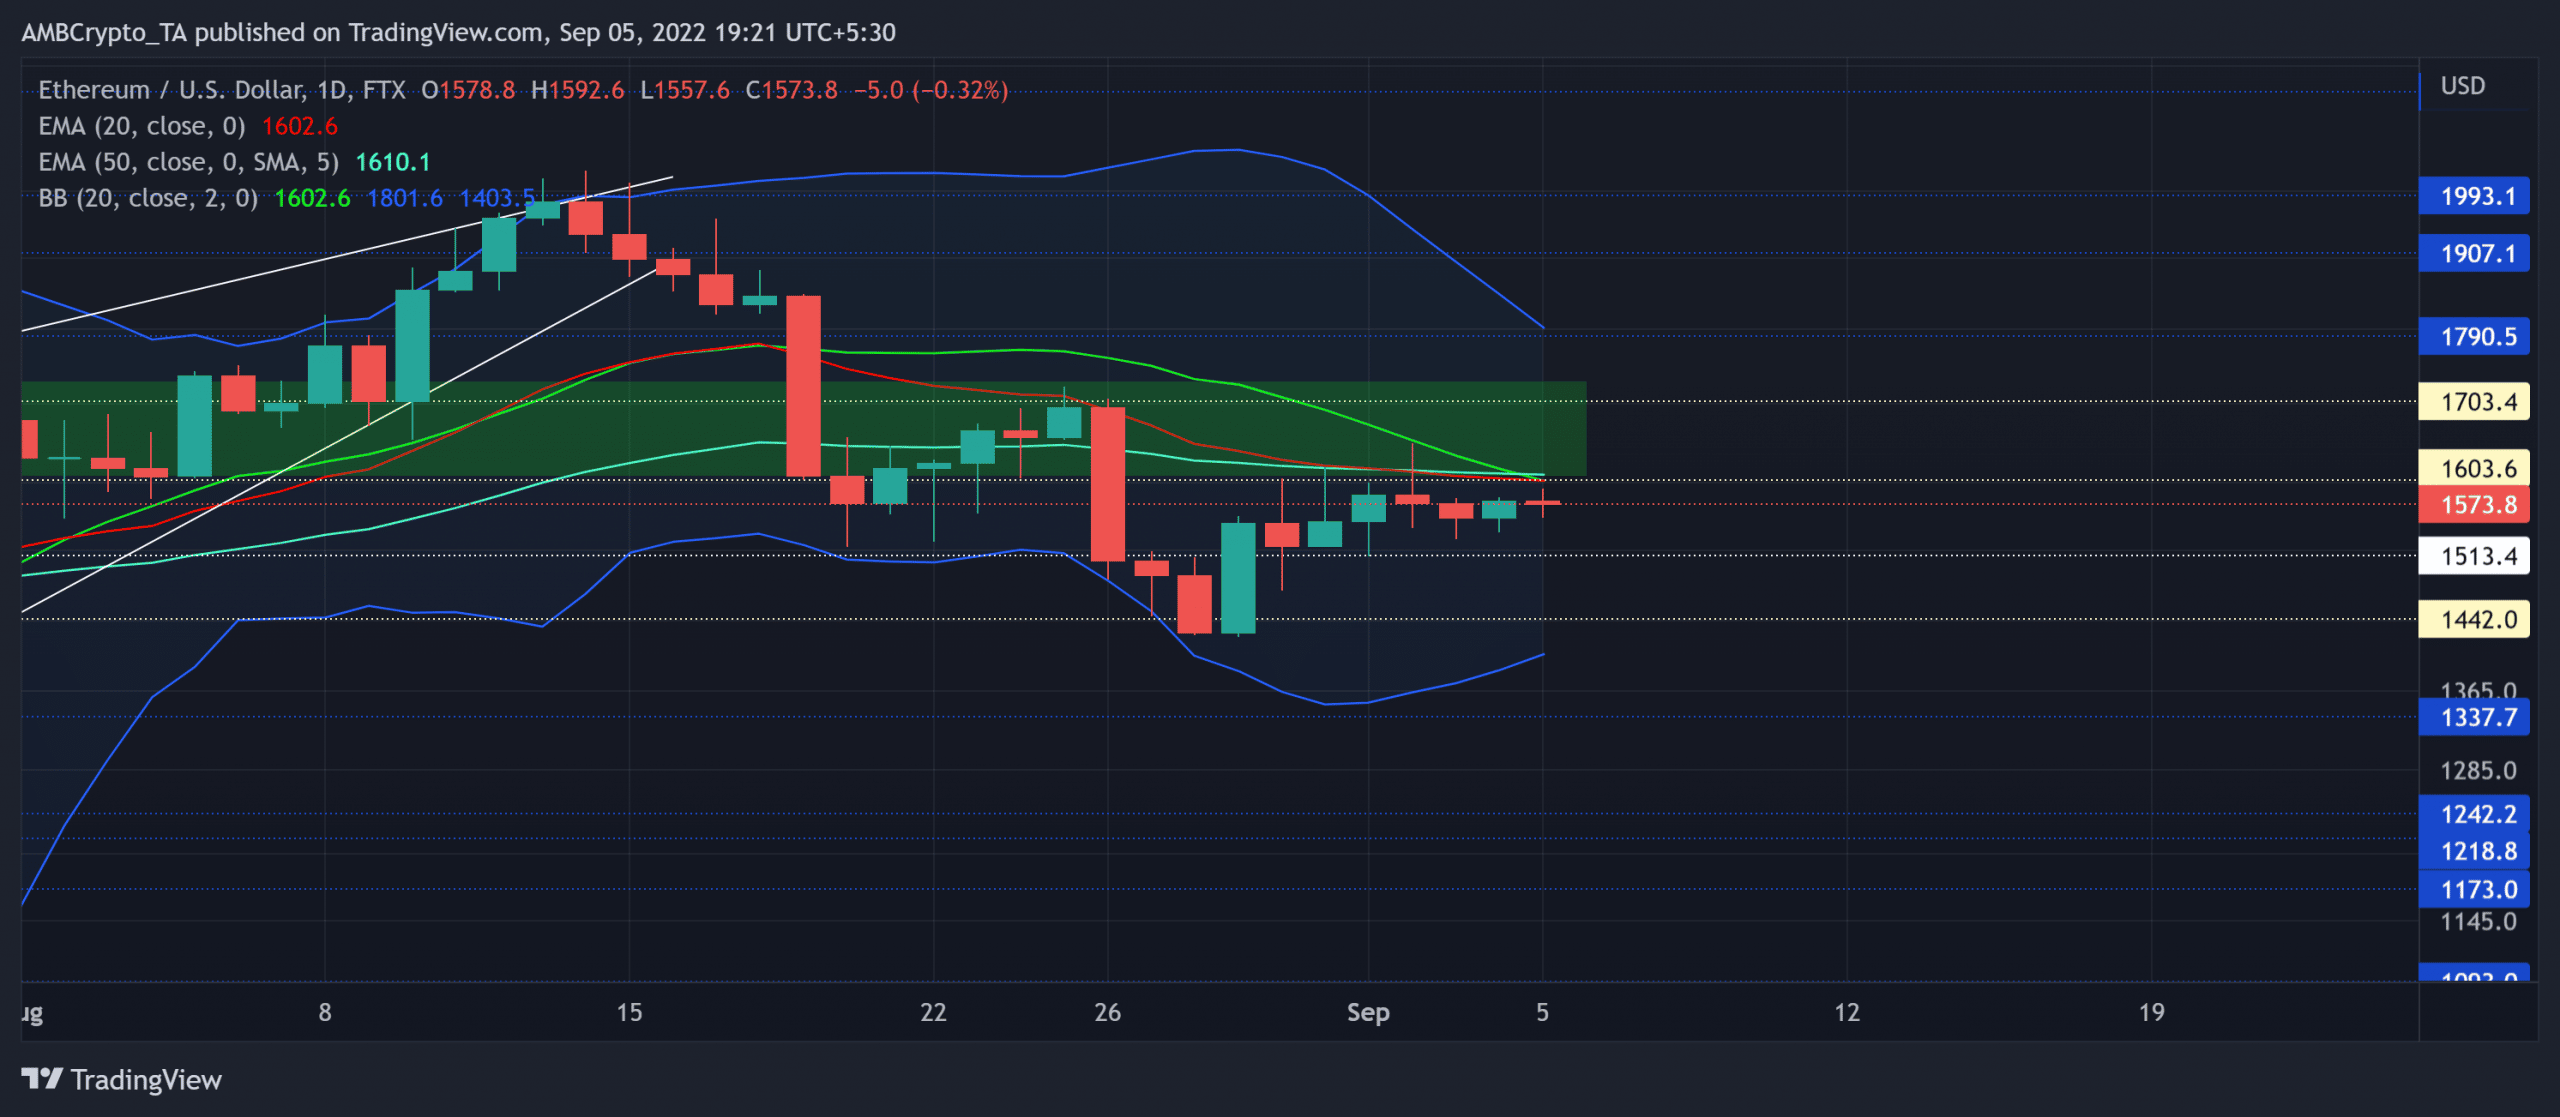
ETH rekindled its bearish force after breaking down from its long-term rising wedge. However, the coin’s growth in the last week has aided the bulls in rebounding from the lower band of the Bollinger Bands (BB). This buying comeback is now facing hurdles near the basis line (green) of BB.
With the bears posing hurdles near the 20 EMA (red) and the 50 EMA (cyan), ETH could see a slight rejection of higher prices from the immediate resistance.
Also, the altcoin witnessed a declining trend in trading volumes during the recent growth. This reading has further affirmed the weakness of the bullish move and made the coin more fragile to volatile breaks.
A close below the $1,600 resistance could propel a downside. In this case, the potential targets would lie in the $1,513-1,440 range. An eventual break above the $1,600 resistance could pave a path for a rather brief bull run toward the $1,703 zone.
Rationale
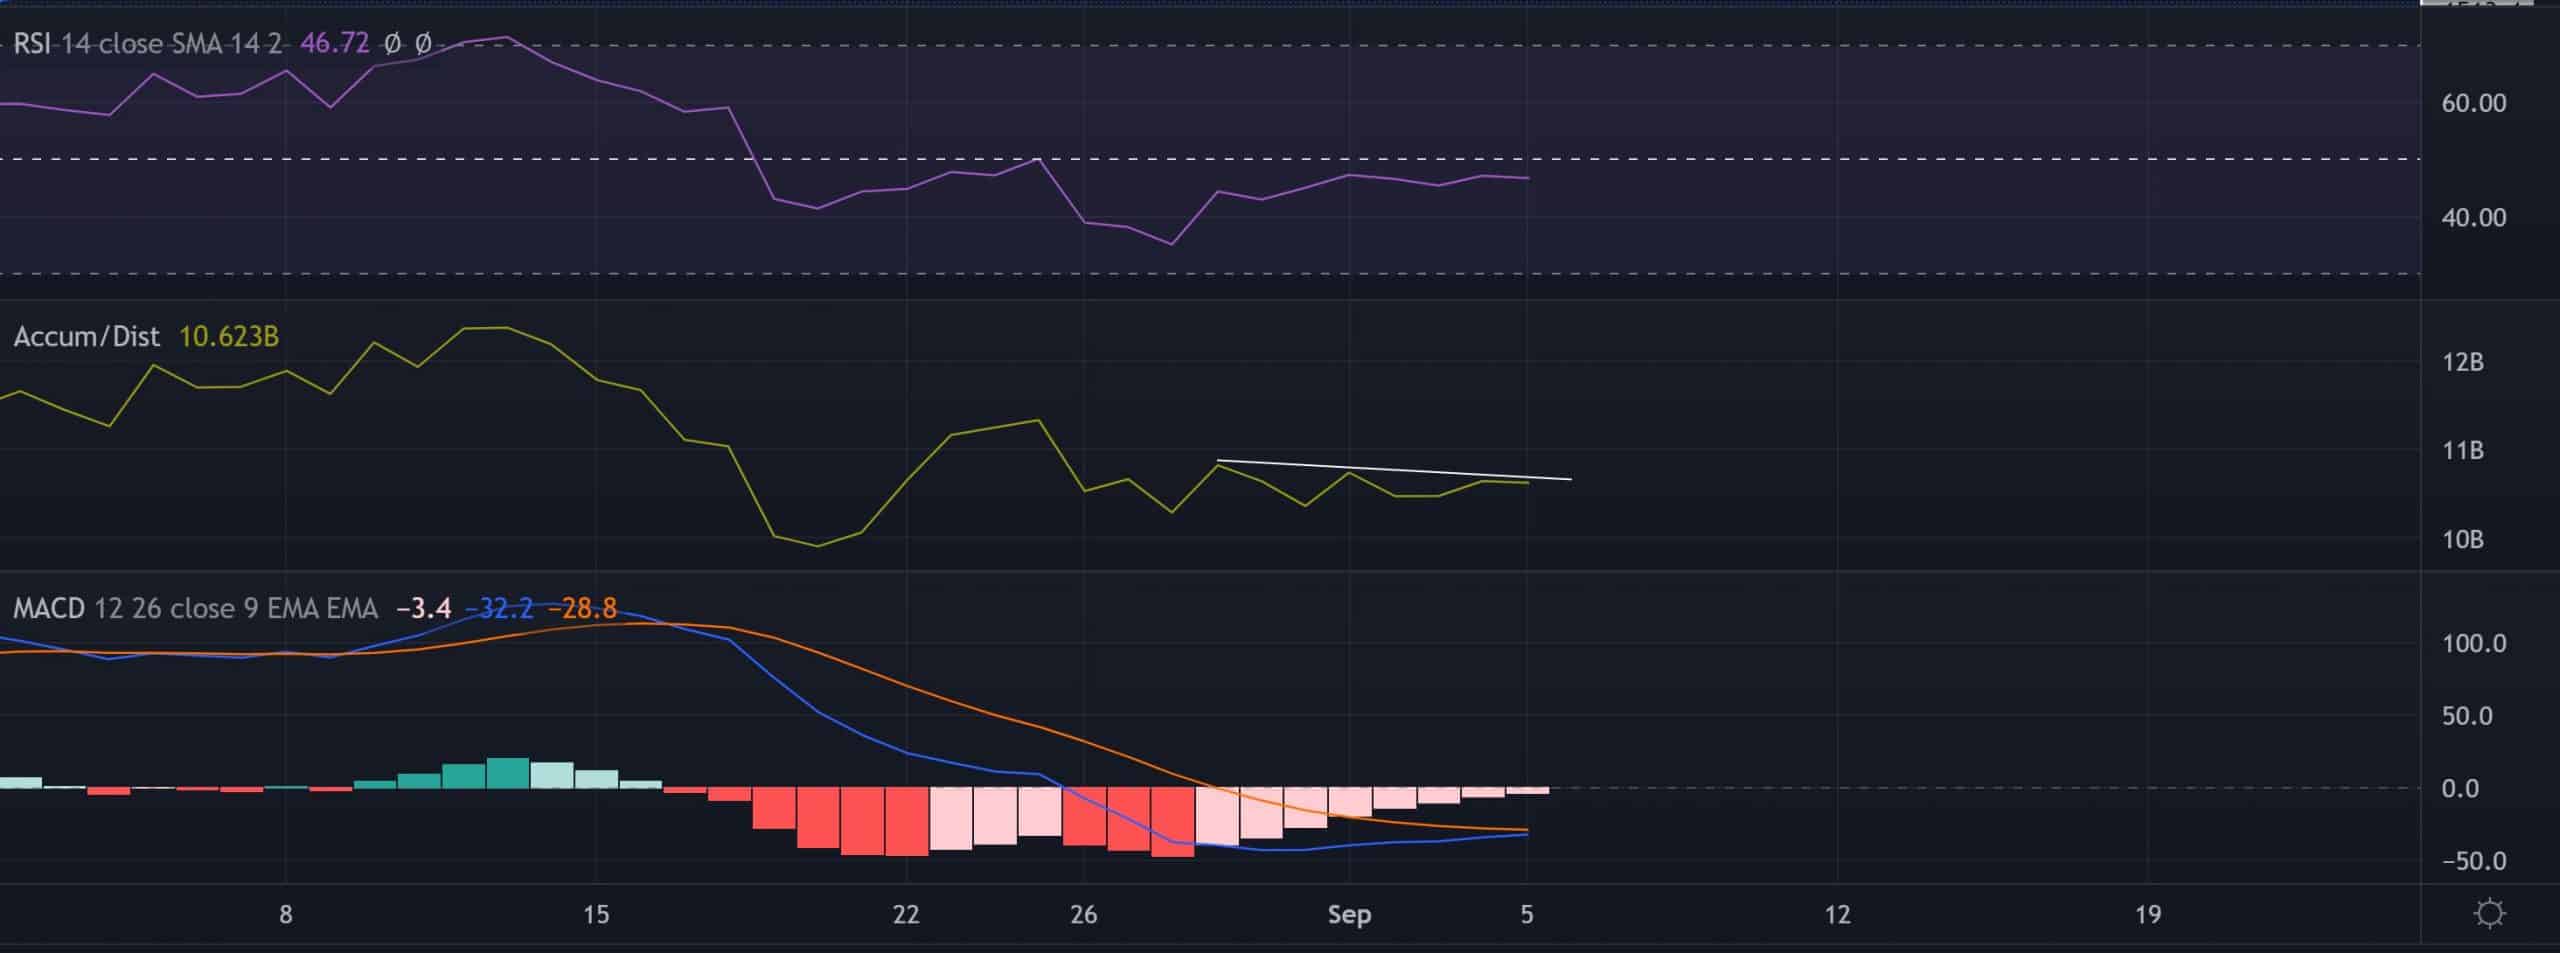
The Relative Strength Index (RSI) moved along the threshold of its equilibrium for the last week. A continued position below this level would aid the sellers in maintaining their advantage.
Furthermore, the Accumulation/Distribution (A/D) saw lower peaks and bearishly diverged with the price. A likely reversal from its trendline resistance would affirm the bearish bias. However, any bullish crossovers on the MACD could hint at bearish invalidation.
Conclusion
Given multiple resistances in the $1,600 region alongside the bearish crossover of the 20/50 EMA, the momentum inclined toward the sellers. A sustained close above the 20/50 EMA would invalidate the bearish inclinations. The targets would remain the same as discussed above.
Finally, investors/traders must watch out for Bitcoin’s [BTC] movement. This is because ETH shares a staggering 95% 30-day correlation with the king coin.


