Ethereum, Waves, Axie Infinity Price Analysis: 30 March

Ethereum saw some selling pressure in the past couple of days, but this was not indicative of the end of the uptrend. Rather, it was likely only a minor pullback toward $3315 before another leg higher. Axie Infinity saw a pullback to a logical demand zone, and Waves was in up-only mode.
Ethereum (ETH)
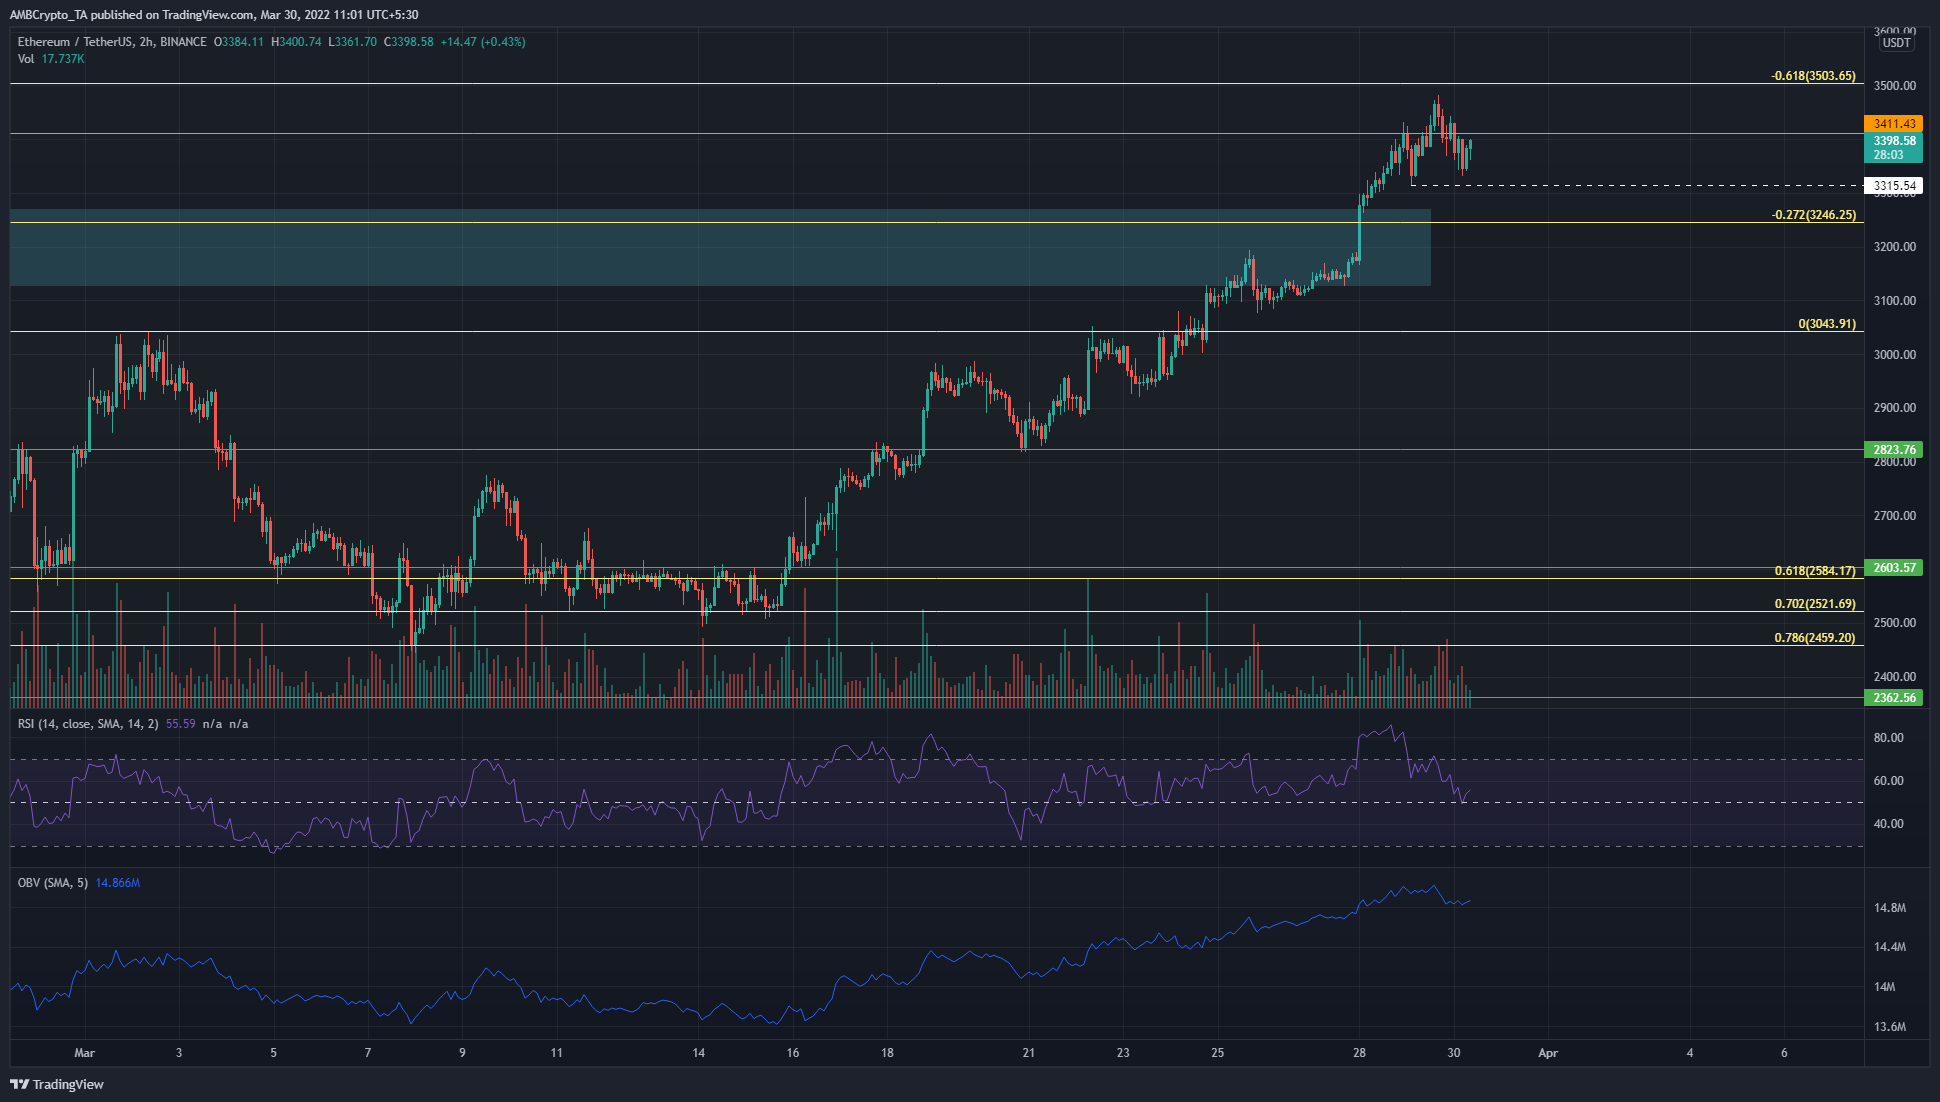
Ethereum was bullish on higher timeframes such as 4-hour and above. On the other hand, the 1-hour and lower timeframes showed that ETH could see a pullback. At press time, using the 2-hour chart, it can be seen that momentum and demand were still in favor of the bulls. The RSI stayed above neutral 50 and showed a hidden bullish divergence developing, while the OBV continued to climb higher.
A session close beneath $3315 could spark a lower timeframe bearish bias, which could see ETH drop to the $3100-$3200 area. This would likely be a buying opportunity.
Waves (WAVES)
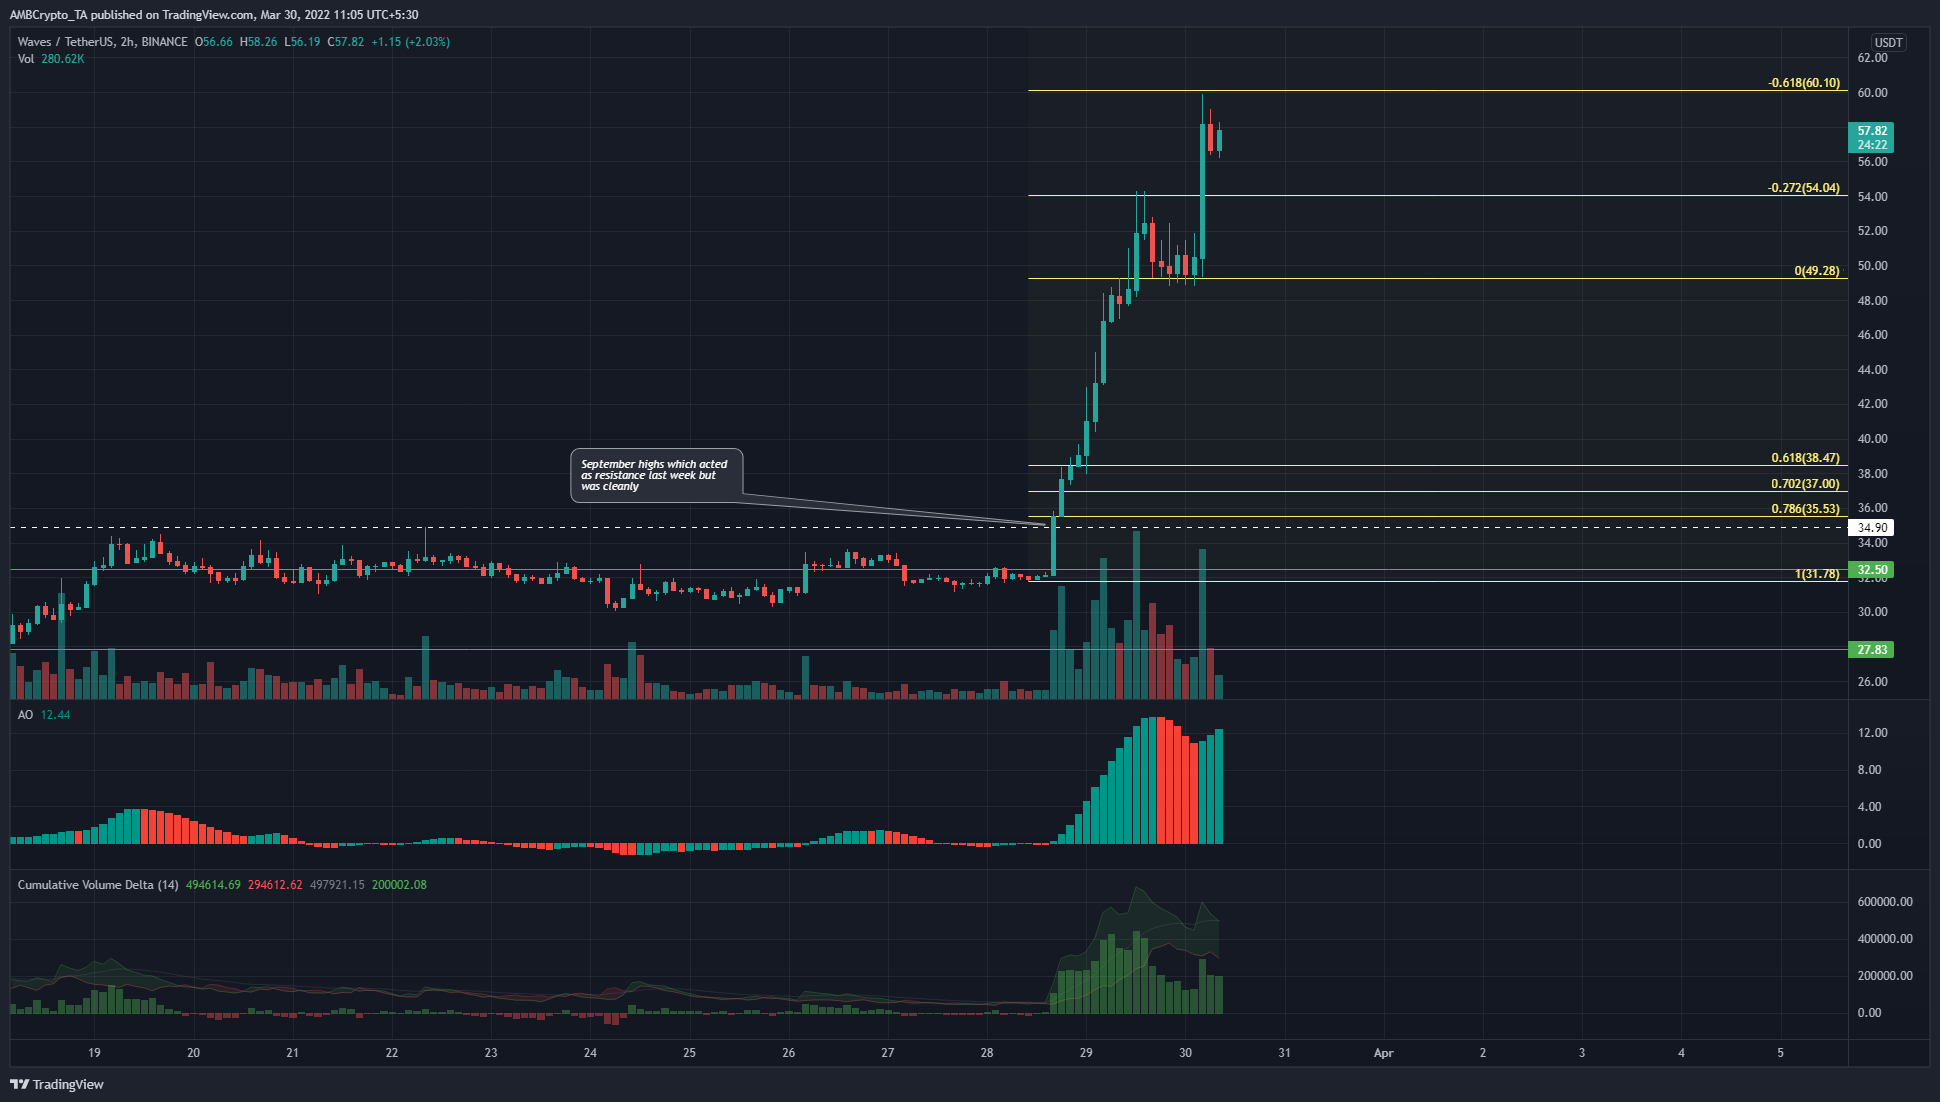
WAVES has been on fire since February, and the past 48 hours have seen gains of nearly 84%. The price almost tested the 61.8% Fibonacci extension level. The $54 and $49.3 levels could act as support on a pullback, while a push beyond $60 would likely see WAVES reach the 100% extension level at $66.7.
The Awesome Oscillator was strongly bullish, although it could form a bearish divergence in the next couple of days, which might see a pullback. The CVD showed good demand behind the rally, and the trading volume has also been enormous.
Axie Infinity (AXS)
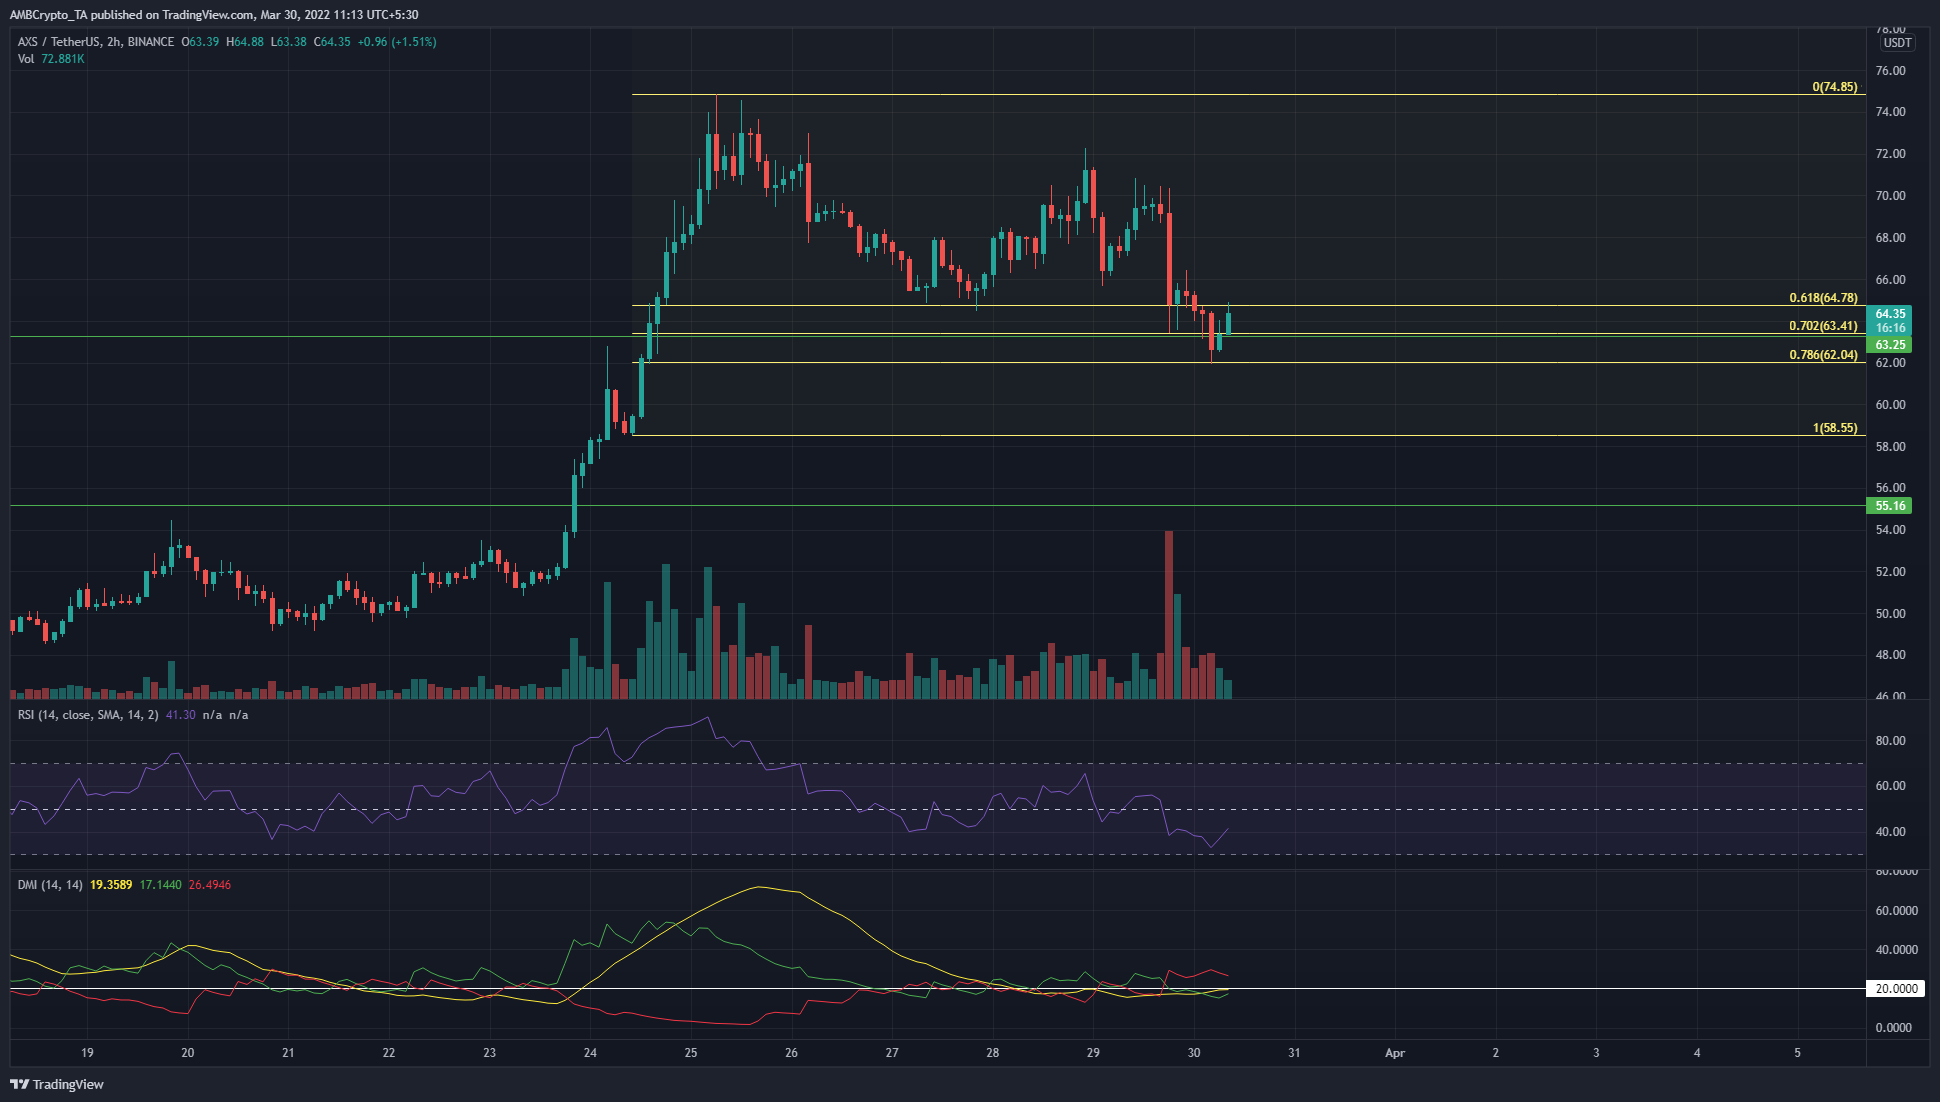
Axie Infinity’s Ronin network suffered a $625m exploit and at the same time this news came out, the price of AXS plunged from $70 to $62. However, based on the move from $58.55 to $74.85 last week, the $62 level is the 78.6% retracement level.
The entire pocket from $62 to $64.8 is a good area to buy AXS at. However, on the 2-hour timeframe, the indicators did not show that bullish momentum had resumed yet. The DMI’s ADX (yellow) and +DI (green) were below 20, and the RSI was also beneath neutral 50.