Ethereum’s fortunes depend on if it avoids a fall to this zone

Disclaimer: The findings of the following article are the sole opinions of the writer and should not be taken as investment advice
On 4 July, Ethereum tested the $2400 resistance for the first time since 17 June. 3 days later, the crypto-asset briefly moved above the 50-Moving Average but the daily candle closed under both the aforementioned resistances and MA. Now, less than 48 hours later, the price dropped by ~8%, dropping down to $2,158 at press time.
At the time of writing, the price action was moving sideways, but a shift might be seen over the next few days depending on how the next move unveils on the chart.
Ethereum 1-day chart
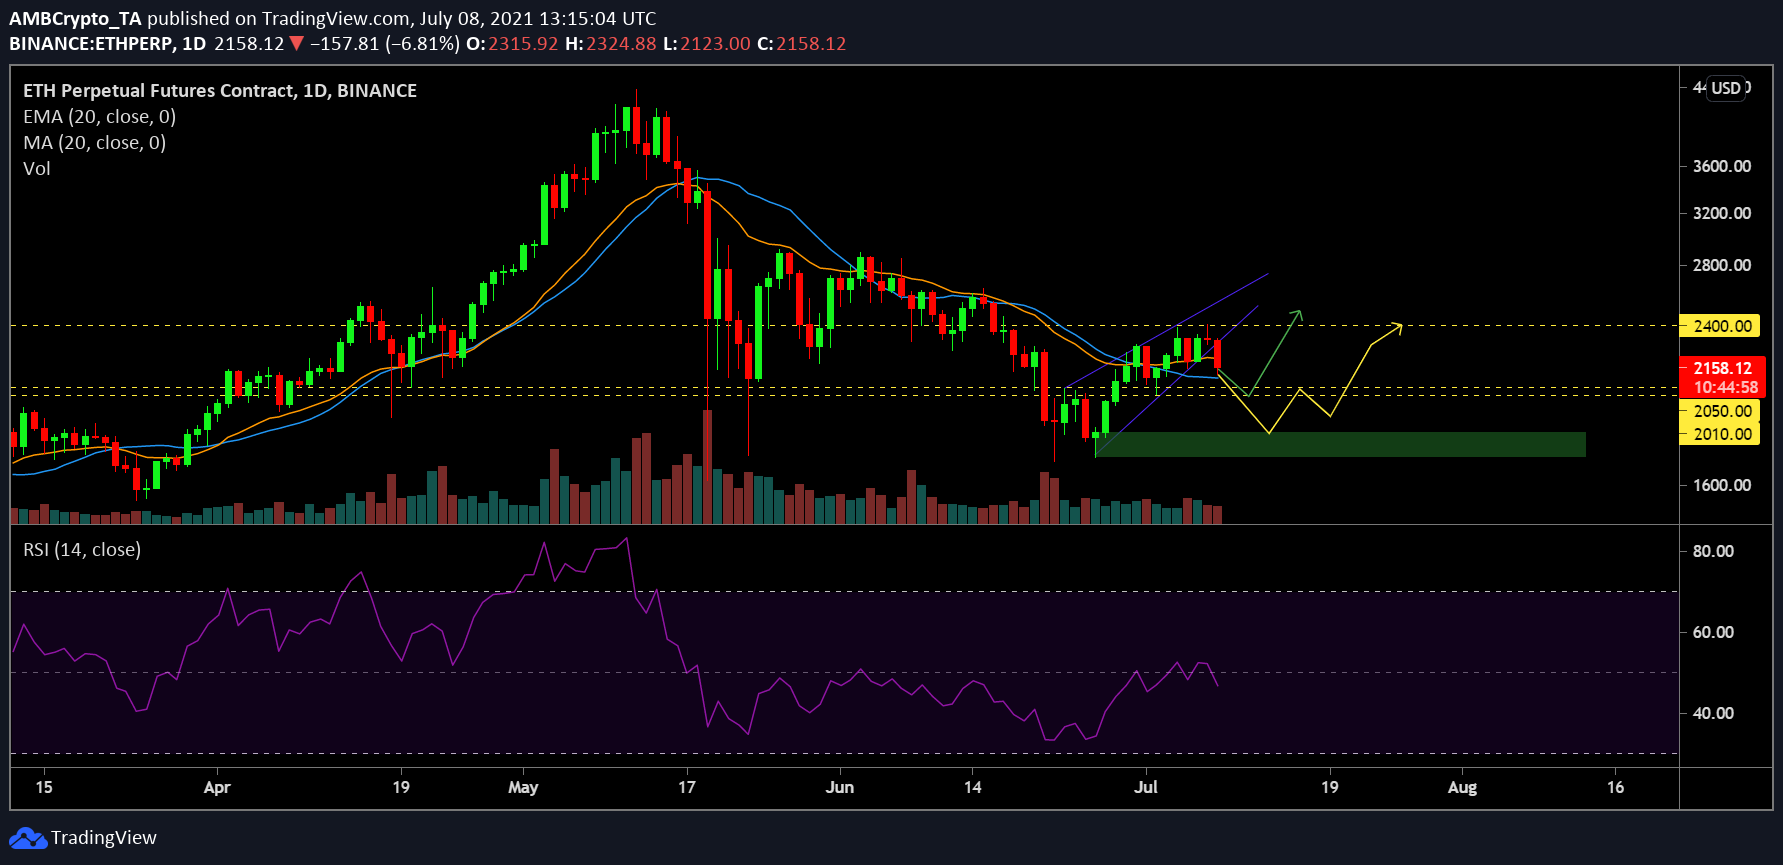
Breaking above $2400 was crucial for Ethereum in order to maintain a strong drive forward, but after a couple of re-tests, the coin was pushed south. One particular bearish move observed on the 1-day chart was the price breakout from the rising wedge pattern. The breakout took place over the last 24 hours, and a possible close under $2300 was made plausible.
At press time, the relationship between the 20-period Exponential MA and Simple MA was bullish as the price remained above the 20-SMA.
However, the buying pressure rejection, as illustrated by the Relative Strength Index or RSI, seemed to point to exhausted buying pressure.
If the price continues to move downwards, a quick bullish turnaround can be expected if the price remains above the $2050-$2010 support range. Otherwise, Ethereum might collapse down to its demand zone at $1800 as well.
Market Rationale

With respect to the Awesome Oscillator indicator, it was picturing recovery of bullish momentum, but the strength remained low. The MACD line was above the Signal line and underlined a bullish trend at press time, one defined over the past few days.
A safe option would be to open a long position near the demand zone, even though that would mean that the price will drop down to $1800. A long contract can be opened at $2050 as well, but risks should be capped to minimal in order to avoid another massive wipeout in the short term.